
Raintree Apartment Homes
650 Tamarack Ave,
Brea, CA 92821
$2,005 - $2,670
Studio - 2 Beds
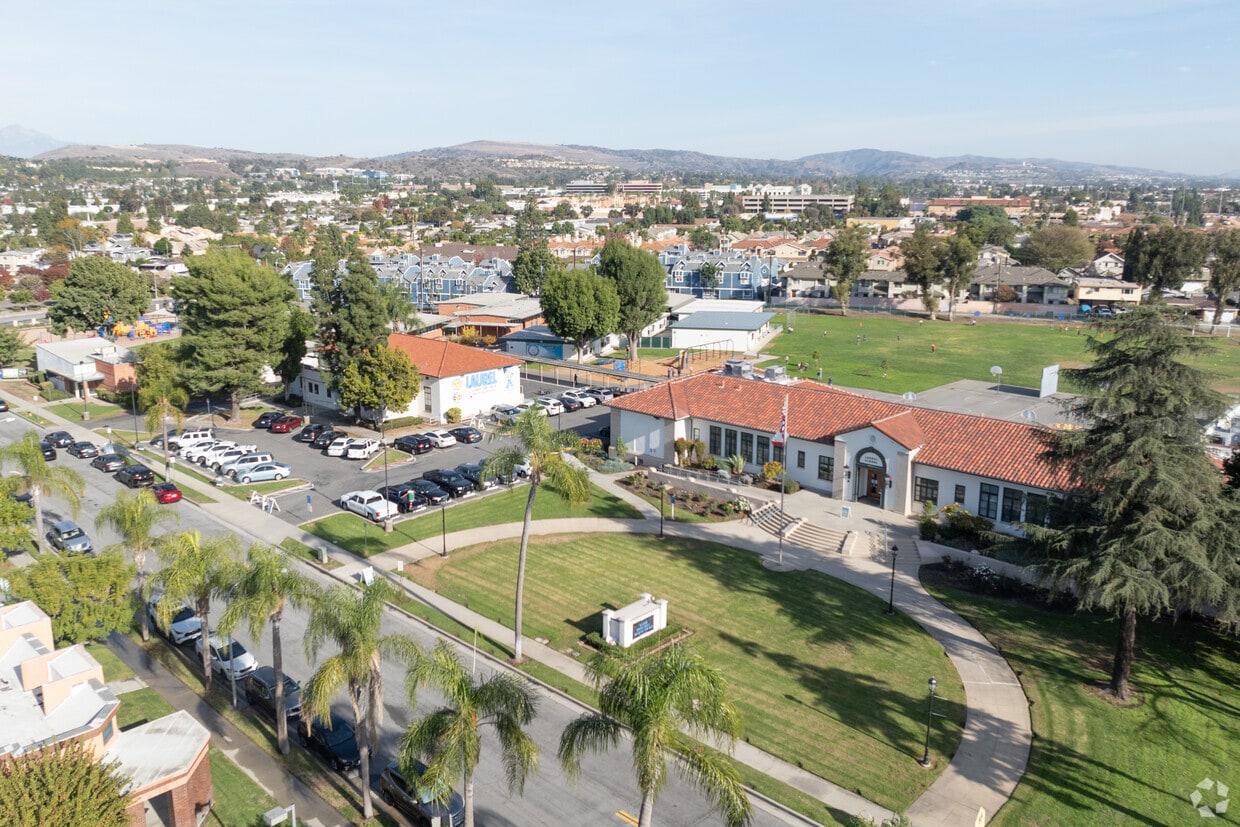
Welcome to Brea, a welcoming city in northern Orange County that combines residential comfort with a dynamic downtown scene. Founded in 1917 as an oil town, Brea has evolved into a community known for its shopping, dining, and arts culture. The centrally located Brea Mall anchors the retail district, while an impressive collection of more than 140 public art installations enhances the cityscape. One-bedroom apartments in Brea average $2,564 per month, reflecting a 4.2% increase over the past year. Housing options include apartment communities and single-family rentals, with popular areas concentrated near downtown and east of the 57 Freeway.
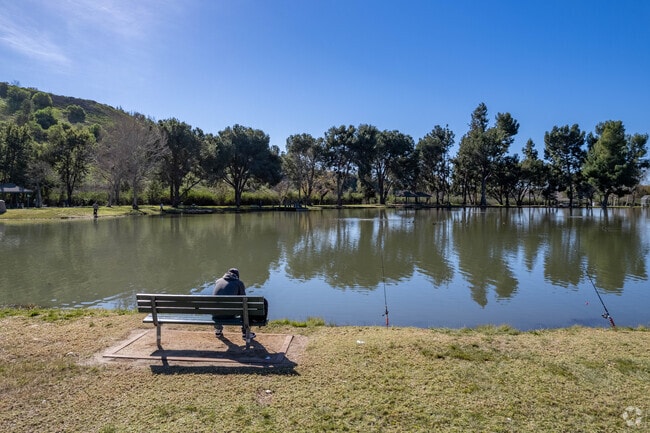
Outdoor recreation awaits at Carbon Canyon Regional Park and Chino Hills State Park, featuring miles of hiking trails and natural spaces. Community life centers around the downtown farmers' market and seasonal events that bring neighbors together. The historic Brea-Olinda Oil Field - a nod to the city's name, which means "tar" in Spanish - preserves the area's oil-producing heritage. Students attend schools within the Brea Olinda Unified School District, recognized with Blue Ribbon and California Distinguished School designations. The Mediterranean climate, characterized by mild temperatures typically between the high 60s and mid-80s Fahrenheit, supports year-round outdoor activities.
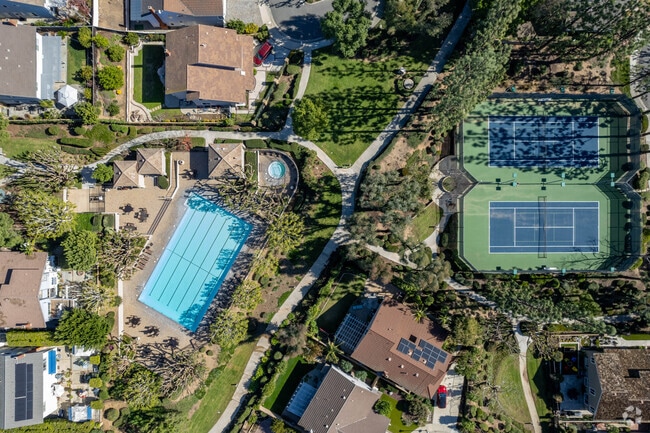
An overview of some Brea residential communities depict luxury amenities like pools and tennis.
Near the shops and restaurants, residents can find street parking.
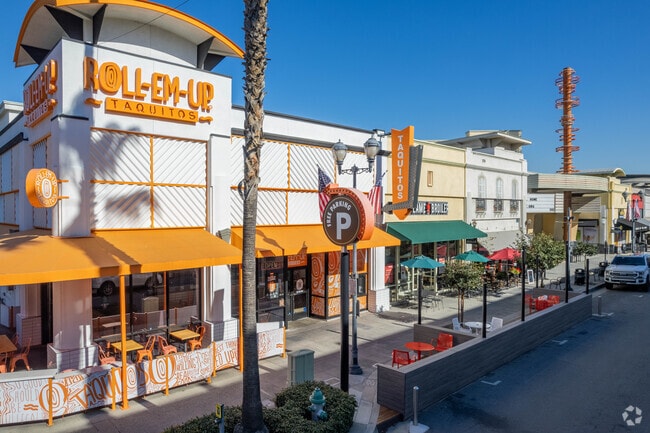
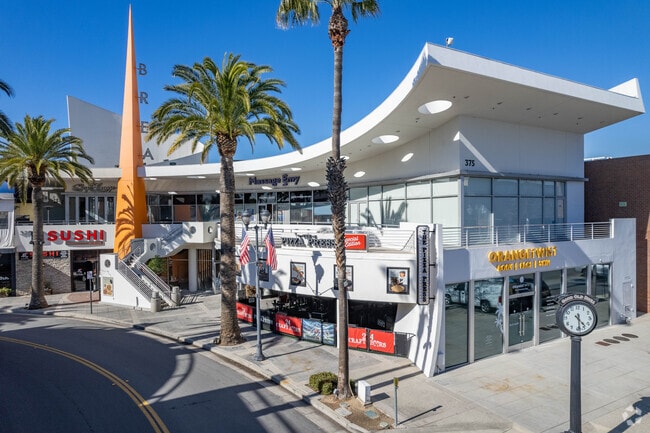
A variety of shops and restaurants can be found throughout Brea.
Brea residents love to jog through Craig Regional Park.
The 57 Freeway links Brea to Los Angeles County at its northern border.
There are many specialty booths at the Spring Craft Boutique.
As of March 2026, the average apartment rent in Brea, CA is $2,176 for a studio, $2,522 for one bedroom, $2,927 for two bedrooms, and $3,024 for three bedrooms. Apartment rent in Brea has increased by 0.2% in the past year.
Explore how walkable, bikeable, drivable, and transit-friendly Brea, CA is for everyday living.
Somewhat Walkable
You might be able to get out and walk when living in this area. Some errands can be accomplished on foot, but for others you’ll need a car.
Minimal Transit
You'll likely want a car when living in this area since it has few transit options.
Bikeable
While there’s some bike infrastructure in this area, you’ll still need a car for many errands.
Public
Grades K-5

Public
Grades K-5

Falcon Academy of Science and Technology
Public
Grades K-5

Public
Grades K-5
Public
Grades K-6

Public
Grades 6-8
Public
Grades 9-12

45
Communities
10,594
Units
27
Cities

64
Communities
11,802
Units
29
Cities

196
Communities
70,873
Units
136
Cities

77
Communities
23,478
Units
49
Cities

77
Communities
23,478
Units
49
Cities

92
Communities
10,200
Units
38
Cities
† Our analysis of utilities, groceries, transportation, healthcare, home prices, and other goods and services is sourced from the Cost of Living Index, a respected benchmark published by the Council for Community and Economic Research (C2ER) that provides a thorough overview of living expenses across different regions.
Rent data is provided by CoStar Group’s Market Trend reports. As the industry leader in commercial real estate information, analytics, and news, CoStar conducts extensive research to produce and maintain a comprehensive database of commercial real estate information. We combine this data with public record to provide the most up-to-date rental information available.
Consumer goods, services, and home prices are sourced from the Cost of Living Index published by the Council for Community and Economic Research (C2ER). The data on this page is updated quarterly. It was last published in February 2026.


