Median Age
40 Years
Largest Age Group
40-49 Years
Approximately 15% of Residents
Under 20
26%
Over 65
18%
Area Guide
Avg Rent
$1,810
Population
31,555
Renter Mix
18% Rent
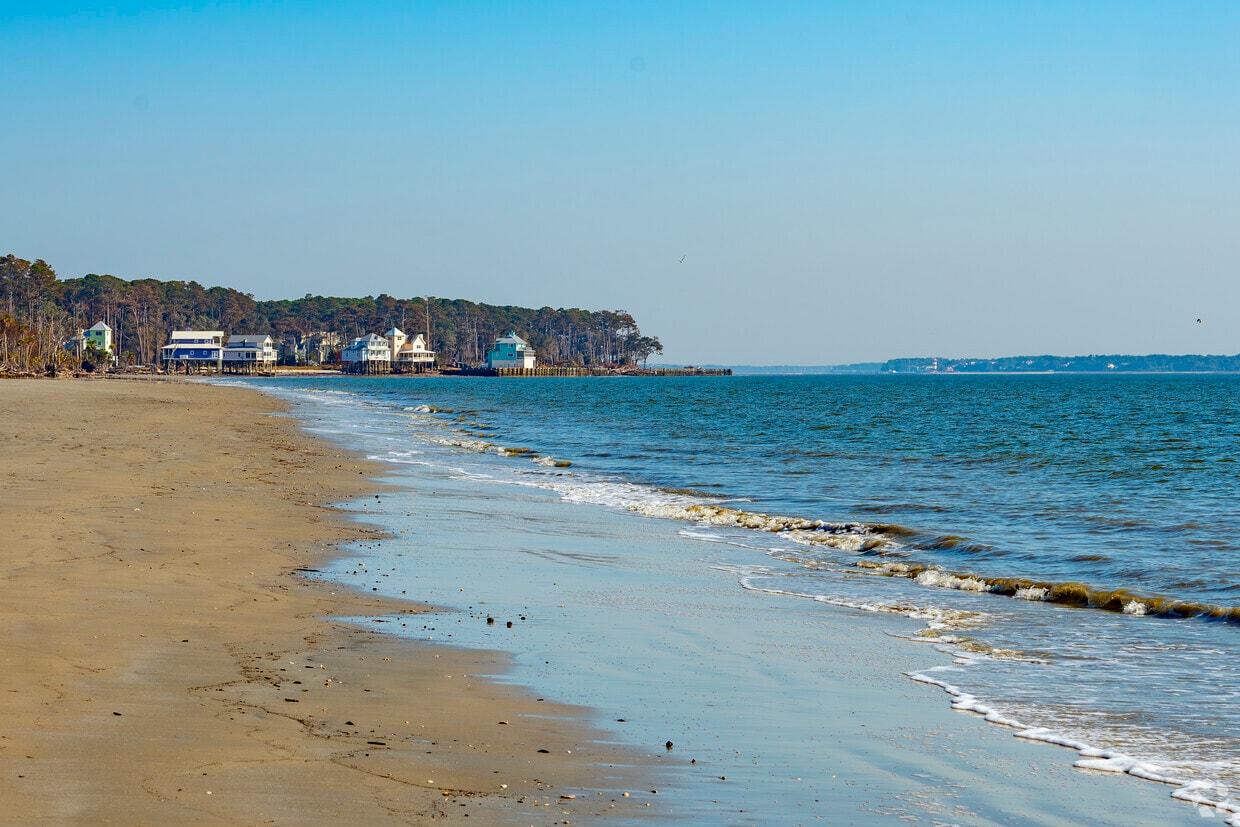
Bluffton, South Carolina combines coastal living with historic Southern architecture along the scenic May River. The town's Old Town district features preserved pre-Civil War buildings, including the Church of the Cross, while art galleries and restaurants line Calhoun Street. Residents enjoy outdoor recreation at the Buckwalter Trail and New River Trailhead Park, along with numerous boat landings and cycling paths throughout the community.
Located between Hilton Head Island and Savannah, Bluffton offers housing options from Old Town properties to newer developments in Palmetto Bluff. The University of South Carolina Beaufort campus contributes to the area's educational landscape. The town's history runs deep - the Church of the Cross, built in 1857, stands as one of several significant pre-Civil War structures that help tell Bluffton's story.
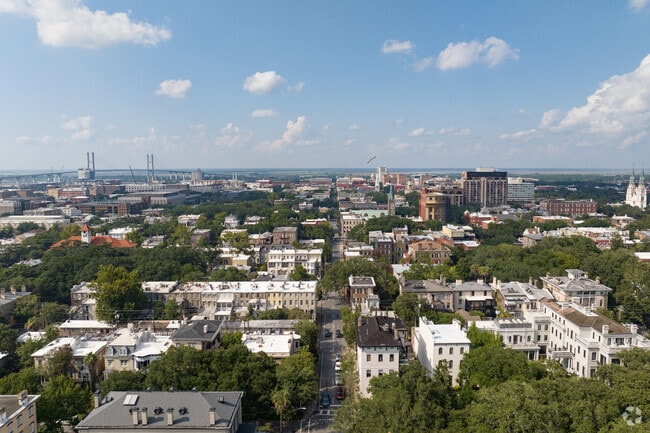
Historic Savannah maintains a rich history and timeless appeal.
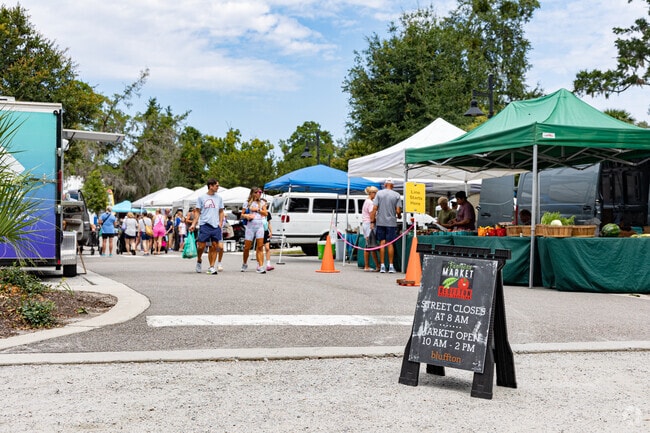
Welcome to the Farmers Market of Bluffton.
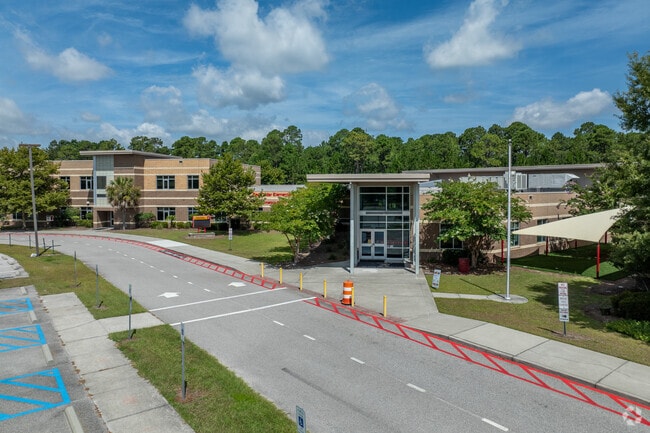
Red Cedar Elementary School takes great care in the education of their students.
Residents and tourists shop the Farmers Market of Bluffton.
Bluffton High School strives to give students a quality education.
Enjoy the swings at DuBois Park.
Median Household Income
$90,660
Average: $109,213
Education
11,759
Residents Have a Degree
Job Market
15,577
Workers Employed
Median Age
40 Years
Largest Age Group
40-49 Years
Approximately 15% of Residents
Under 20
26%
Over 65
18%
Housing Distribution
Bluffton has more homeowners than renters.

Education Distribution
Review this city's overall education levels.

As of June 2026, the average apartment rent in Bluffton, SC is $1,123 for a studio, $1,820 for one bedroom, $2,067 for two bedrooms, and $2,389 for three bedrooms. Apartment rent in Bluffton has decreased by -0.5% in the past year.
Explore how walkable, bikeable, drivable, and transit-friendly Bluffton, SC is for everyday living.
Exceptionally Drivable
Drivability
Fairly Bikeable
Bikeability
Public
Grades PK-5
1,005 Students

Public
Grades PK-5
609 Students

Public
Grades PK-5
609 Students
Public
Grades PK-8
1,120 Students

Public
Grades PK-5
696 Students
Public
Grades PK-8
1,120 Students
Public
Grades 6-8
872 Students

Public
Grades 6-8
872 Students
Public
Grades 6-8
889 Students

Public
Grades 6-8
889 Students
Public
Grades 9-12
1,601 Students
Public
Grades 9-12
1,350 Students
Public
Grades 9-12
1,350 Students
† Our analysis of utilities, groceries, transportation, healthcare, home prices, and other goods and services is sourced from the Cost of Living Index, a respected benchmark published by the Council for Community and Economic Research (C2ER) that provides a thorough overview of living expenses across different regions.
Rent data is provided by CoStar Group’s Market Trend reports. As the industry leader in commercial real estate information, analytics, and news, CoStar conducts extensive research to produce and maintain a comprehensive database of commercial real estate information. We combine this data with public record to provide the most up-to-date rental information available.
Consumer goods, services, and home prices are sourced from the Cost of Living Index published by the Council for Community and Economic Research (C2ER). The data on this page is updated quarterly. It was last published in June 2026.
Demographic information comes from Neustar and combines detailed address data with U.S. Census and American Community Survey statistics to produce reliable local estimates.


