Median Age
28 Years
Largest Age Group
20-29 Years
Approximately 34% of Residents
Under 20
22%
Over 65
11%


Avg Rent
$1,109
Population
78,220
Renter Mix
68% Rent
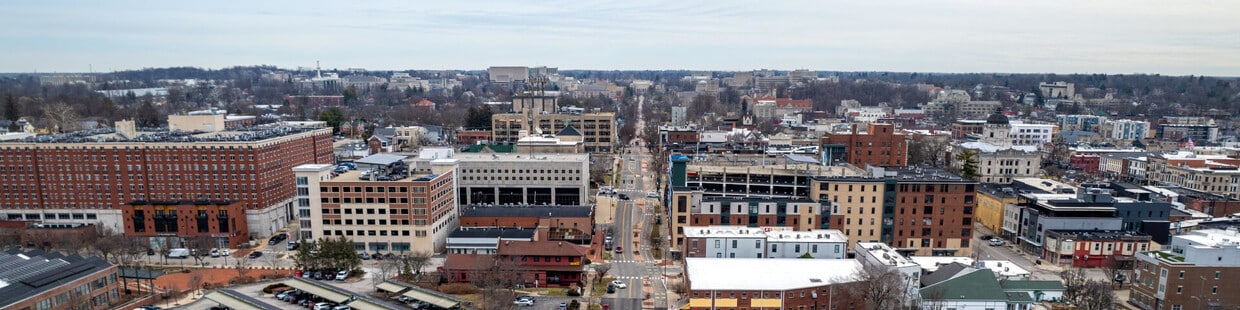
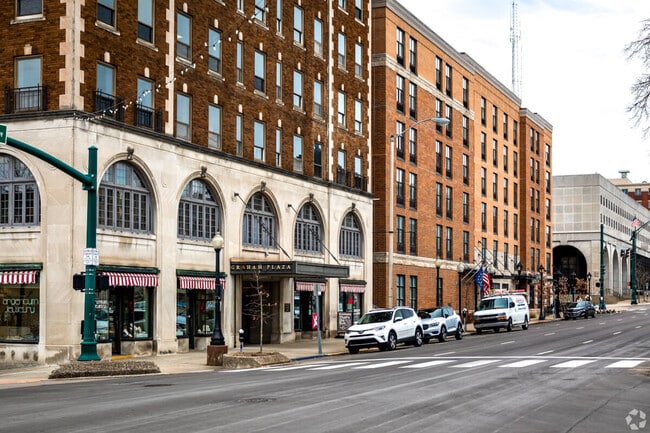
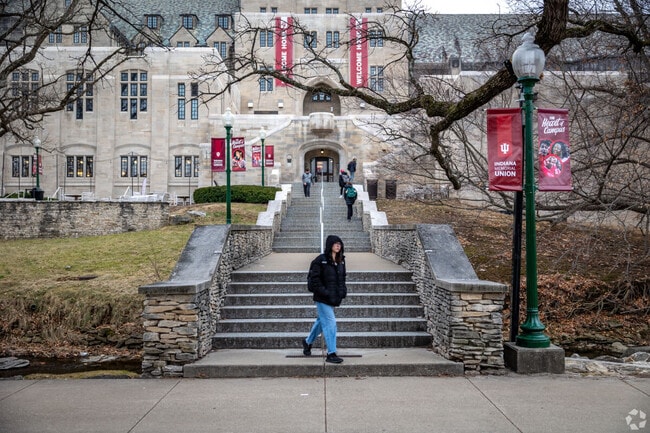
Located in south-central Indiana, Bloomington combines college-town energy with small-town appeal. As home to Indiana University's main campus with its 45,000 students, the city offers rich cultural and educational opportunities. The downtown area features both contemporary and historic buildings, anchored by the limestone Sample Gates that welcome visitors to IU's campus. Housing options include apartments near campus and residential neighborhoods throughout the city. Currently, renters can expect to pay around $1,116 for a one-bedroom apartment, with rental rates showing a modest annual increase of about 3.3%.
Bloomington's dedication to preserving green spaces earned its Tree City USA designation in 1984. The B-Line Trail connects downtown destinations, while Griffy Lake Nature Preserve and Lake Monroe provide hiking trails, boating, and fishing. Cultural attractions include performances at the restored 1922 Buskirk-Chumley Theater and exhibits at the Eskenazi Museum of Art. Notable areas include the Prospect Hill Historic District, known for its preserved architecture, and the downtown district, where apartments stand alongside local businesses. The city gained fame as the setting for "Breaking Away" (1979), highlighting the annual Little 500 bicycle race that remains a celebrated tradition.
The downtown district of Bloomington offers a wide variety of activities to enjoy.
Monroe Lake offers outdoor fun in South Bloomington.
Indiana University is the city's largest employer with around 12,000 faculty members.
Median Household Income
$38,094
Average: $62,833
Education
33,238
Residents Have a Degree
Job Market
37,375
Workers Employed
Median Age
28 Years
Largest Age Group
20-29 Years
Approximately 34% of Residents
Under 20
22%
Over 65
11%
Housing Distribution
Bloomington has more renters than homeowners.

Education Distribution
Review this city's overall education levels.

As of August 2026, the average apartment rent in Bloomington, IN is $1,026 for a studio, $1,105 for one bedroom, $1,298 for two bedrooms, and $1,667 for three bedrooms. Apartment rent in Bloomington has decreased by -1.5% in the past year.
The cost of living in Bloomington, IN is 0.6% lower than the national average. Generally, housing in Bloomington is 0.8% less expensive than the national average, with rent falling between $1,026 - $1,667. You can expect to pay 1.4% more for groceries, 7.4% less for utilities, and 2.3% more for transportation.
Compare Cities
Explore how walkable, bikeable, drivable, and transit-friendly Bloomington, IN is for everyday living.
Fairly Walkable
Walkability
Minimal Public Transit
Transit
Very Drivable
Drivability
Moderately Bikeable
Bikeability
Public
Grades PK-5
222 Students

Public
Grades PK-5
596 Students

Public
Grades PK-5
507 Students
Public
Grades PK-5
446 Students
Public
Grades PK-5
408 Students
Public
Grades 6-8
572 Students
Public
Grades 6-8
574 Students

Lora L Batchelor Middle School
Public
Grades 6-8
478 Students
The Bloomington Project School
Public
Grades K-8
317 Students
Public
Grades 6-12
99 Students

Public
Grades 9-12
1,691 Students

The Academy of Science and Entrepreneurship
Public
Grades 9-12
79 Students
Public
Grades 9-12
1,590 Students
Public
Grades 6-12
99 Students
Public
Grades 9-12
124 Students

† Our analysis of utilities, groceries, transportation, healthcare, home prices, and other goods and services is sourced from the Cost of Living Index, a respected benchmark published by the Council for Community and Economic Research (C2ER) that provides a thorough overview of living expenses across different regions.
Rent data is provided by CoStar Group’s Market Trend reports. As the industry leader in commercial real estate information, analytics, and news, CoStar conducts extensive research to produce and maintain a comprehensive database of commercial real estate information. We combine this data with public record to provide the most up-to-date rental information available.
Consumer goods, services, and home prices are sourced from the Cost of Living Index published by the Council for Community and Economic Research (C2ER). The data on this page is updated quarterly. It was last published in June 2026.
Demographic information comes from Neustar and combines detailed address data with U.S. Census and American Community Survey statistics to produce reliable local estimates.


