Median Age
28 Years
Largest Age Group
20-29 Years
Approximately 39% of Residents
Under 20
20%
Over 65
9%


Avg Rent
$1,293
Population
34,530
Renter Mix
71% Rent
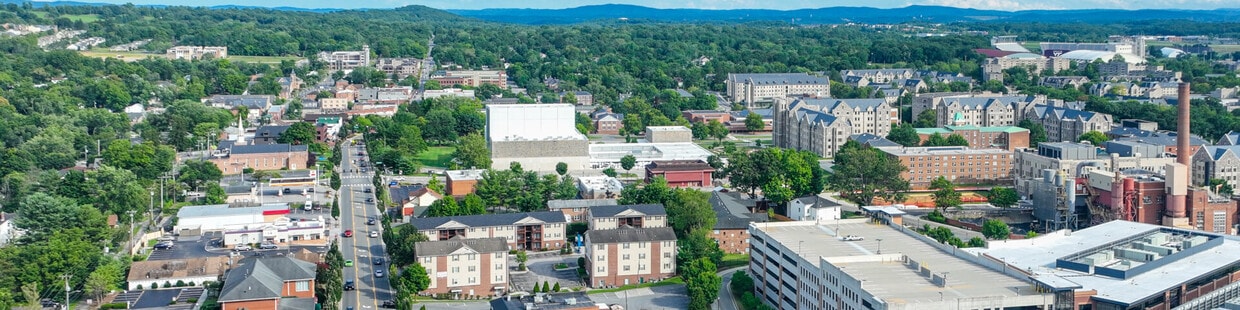
Welcome to Blacksburg, located in Virginia's New River Valley. As the home of Virginia Tech, this mountain community sits at an elevation of 2,080 feet, combining academic spirit with small-town appeal. The rental market offers various housing options throughout the area. Currently, average rents range from $984 for studios to $1,447 for two-bedroom units, with a moderate year-over-year increase of 3.7%. Notable residential areas include the historic 16 Squares neighborhood downtown and the area near the Virginia Tech Corporate Research Center.
Residents enjoy outdoor recreation on the Huckleberry Trail, which connects Blacksburg to neighboring Christiansburg. The downtown district comes alive during signature events like the Steppin' Out Festival in August and the International Street Fair in spring. The Moss Arts Center and the restored 1930s Lyric Theatre anchor the local arts scene. Founded in 1798, Blacksburg's history is preserved at sites like the Smithfield Plantation, a historic landmark on the Virginia Tech campus. The town's technology heritage includes the Blacksburg Electronic Village initiative, which helped establish early community-wide internet access in 1993.
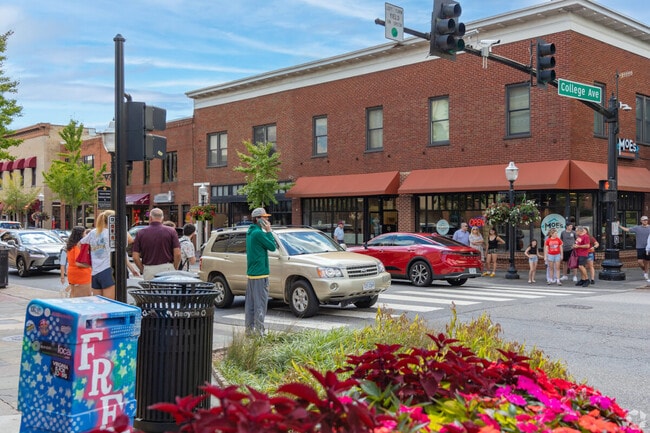
Downtown Blacksburg is the place to be.
Enjoy the pleasant weather at Northside Park in Blacksburg.
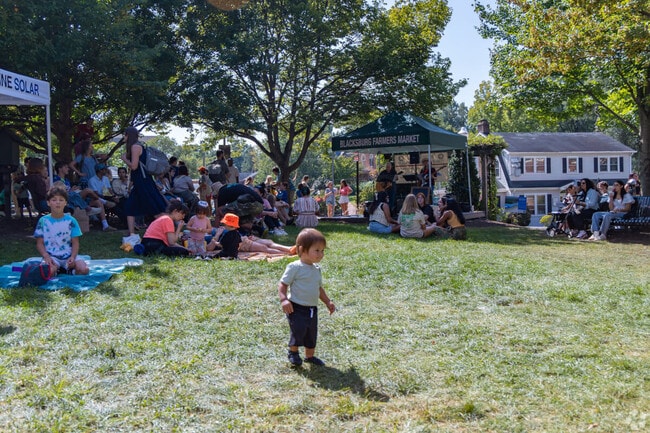
Residents of Blacksburg love to visit the Farmers Market in Blacksburg.
Median Household Income
$36,728
Average: $68,780
Education
16,002
Residents Have a Degree
Job Market
14,545
Workers Employed
Median Age
28 Years
Largest Age Group
20-29 Years
Approximately 39% of Residents
Under 20
20%
Over 65
9%
Housing Distribution
Blacksburg has more renters than homeowners.

Education Distribution
Review this city's overall education levels.

As of July 2026, the average apartment rent in Blacksburg, VA is $896 for a studio, $1,293 for one bedroom, $1,475 for two bedrooms, and $1,804 for three bedrooms. Apartment rent in Blacksburg has increased by 2.7% in the past year.
The cost of living in Blacksburg, VA is 4.1% lower than the national average. Generally, housing in Blacksburg is 7.1% less expensive than the national average, with rent falling between $896 - $1,804. You can expect to pay 3.8% less for groceries, 10.4% less for utilities, and 5.4% less for transportation.
Compare Cities
Explore how walkable, bikeable, drivable, and transit-friendly Blacksburg, VA is for everyday living.
Fairly Walkable
Walkability
Some Public Transit
Transit
Exceptionally Drivable
Drivability
Very Bikeable
Bikeability
Public
Grades K-5
358 Students

Margaret Beeks Elementary School
Public
Grades PK-5
346 Students

Gilbert Linkous Elementary School
Public
Grades PK-5
292 Students
Harding Avenue Elementary School
Public
Grades K-5
296 Students

Public
Grades K-5
296 Students
Public
Grades 6-8
946 Students

Public
Grades 6-8
946 Students
Public
Grades 9-12
1,321 Students
Public
Grades 9-12
1,321 Students
† Our analysis of utilities, groceries, transportation, healthcare, home prices, and other goods and services is sourced from the Cost of Living Index, a respected benchmark published by the Council for Community and Economic Research (C2ER) that provides a thorough overview of living expenses across different regions.
Rent data is provided by CoStar Group’s Market Trend reports. As the industry leader in commercial real estate information, analytics, and news, CoStar conducts extensive research to produce and maintain a comprehensive database of commercial real estate information. We combine this data with public record to provide the most up-to-date rental information available.
Consumer goods, services, and home prices are sourced from the Cost of Living Index published by the Council for Community and Economic Research (C2ER). The data on this page is updated quarterly. It was last published in June 2026.
Demographic information comes from Neustar and combines detailed address data with U.S. Census and American Community Survey statistics to produce reliable local estimates.


