
The Charles
7342 Wisconsin Ave,
Bethesda, MD 20814
$2,271 - $9,256 Total Monthly Price
Studio - 2 Beds


Welcome to Bethesda, Maryland, located just northwest of Washington, D.C. This established community combines metropolitan conveniences with tree-lined streets and an active arts scene. The walkable downtown area features both high-rise apartments and garden-style rentals, with current average rents ranging from $1,916 for studios to $7,595 for four-bedroom units. The rental market remains competitive, showing steady growth with increases between 0.5% to 7.9% across different unit sizes over the past year. The Woodmont Triangle neighborhood and Bethesda Row area each offer their own distinct character, with local shops and restaurants within walking distance.
Bethesda serves as a significant medical research center, home to both the National Institutes of Health and Walter Reed National Military Medical Center. The Capital Crescent Trail provides miles of paved paths for walking, running, and cycling, while downtown Bethesda features independent theaters and galleries. The Metro's Red Line connects residents directly to Washington, D.C., making commuting straightforward. Originally established around the Bethesda Meeting House in 1820, the community maintains its historical roots while embracing modern development. The annual Bethesda Row Arts Festival continues to be a cornerstone event, bringing artists and art enthusiasts together each fall.
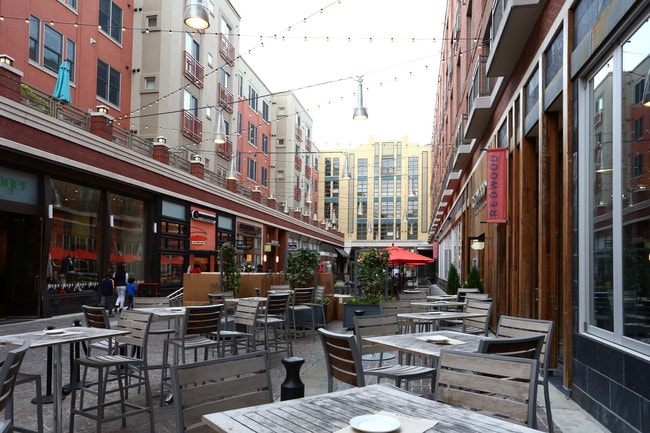
The popular Bethesda Row is a walkable mixed-use area located downtown.
North Bethesda is home to the prestigious Walter Reed National Military Medical Center.
It's always tee time at Woodhaven's Burning Tree Golf Club.
Find solace in nature along Glen Echo's C&O Canal, a haven for outdoor enthusiasts.
Woodmont Triangle is the hub of nightlife in downtown Bethesda.
From small boutiques to major retailers, Bethesda Row has it all in Downtown Bethesda.
As of March 2026, the average apartment rent in Bethesda, MD is $1,960 for a studio, $2,407 for one bedroom, $3,403 for two bedrooms, and $5,117 for three bedrooms. Apartment rent in Bethesda has decreased by -1.5% in the past year.
The cost of living in Bethesda, MD is 34.4% higher than the national average. Generally, housing in Bethesda is 95.4% more expensive than the national average, with rent falling between $1,966 - $5,119. You can expect to pay 8.8% more for groceries, 9.9% more for utilities, and 0.4% more for transportation.
Explore how walkable, bikeable, drivable, and transit-friendly Bethesda, MD is for everyday living.
Very Walkable
If you enjoy walking, you’ll enjoy renting in this area! It’s a very walkable neighborhood.
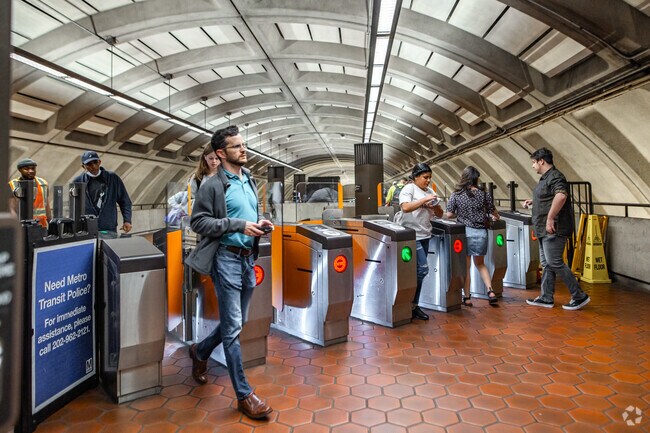
Good Transit
The area around this property has good transit with many nearby transportation options.
Very Bikeable
This area is very bikeable. You’ll find a variety of bike paths and lanes.
Public
Grades PK-5

Public
Grades PK-5
Public
Grades K-5

Public
Grades K-5
Public
Grades PK-5
Public
Grades 6-8
Public
Grades 6-8
Public
Grades 6-8
Public
Grades 9-12
Public
Grades 9-12
Public
Grades 9-12


391
Communities
120,212
Units
157
Cities

185
Communities
59,980
Units
106
Cities

63
Communities
7,683
Units
10
Cities

3,491
Communities
958,581
Units
894
Cities

14
Communities
2,896
Units
3
Cities

716
Communities
198,387
Units
338
Cities
† Our analysis of utilities, groceries, transportation, healthcare, home prices, and other goods and services is sourced from the Cost of Living Index, a respected benchmark published by the Council for Community and Economic Research (C2ER) that provides a thorough overview of living expenses across different regions.
Rent data is provided by CoStar Group’s Market Trend reports. As the industry leader in commercial real estate information, analytics, and news, CoStar conducts extensive research to produce and maintain a comprehensive database of commercial real estate information. We combine this data with public record to provide the most up-to-date rental information available.
Consumer goods, services, and home prices are sourced from the Cost of Living Index published by the Council for Community and Economic Research (C2ER). The data on this page is updated quarterly. It was last published in February 2026.


