Median Age
43 Years
Largest Age Group
35-44 Years
Approximately 14% of Residents
Under 20
21%
Over 65
21%
Area Guide
Avg Rent
$1,467
Population
63,195
Renter Mix
42% Rent
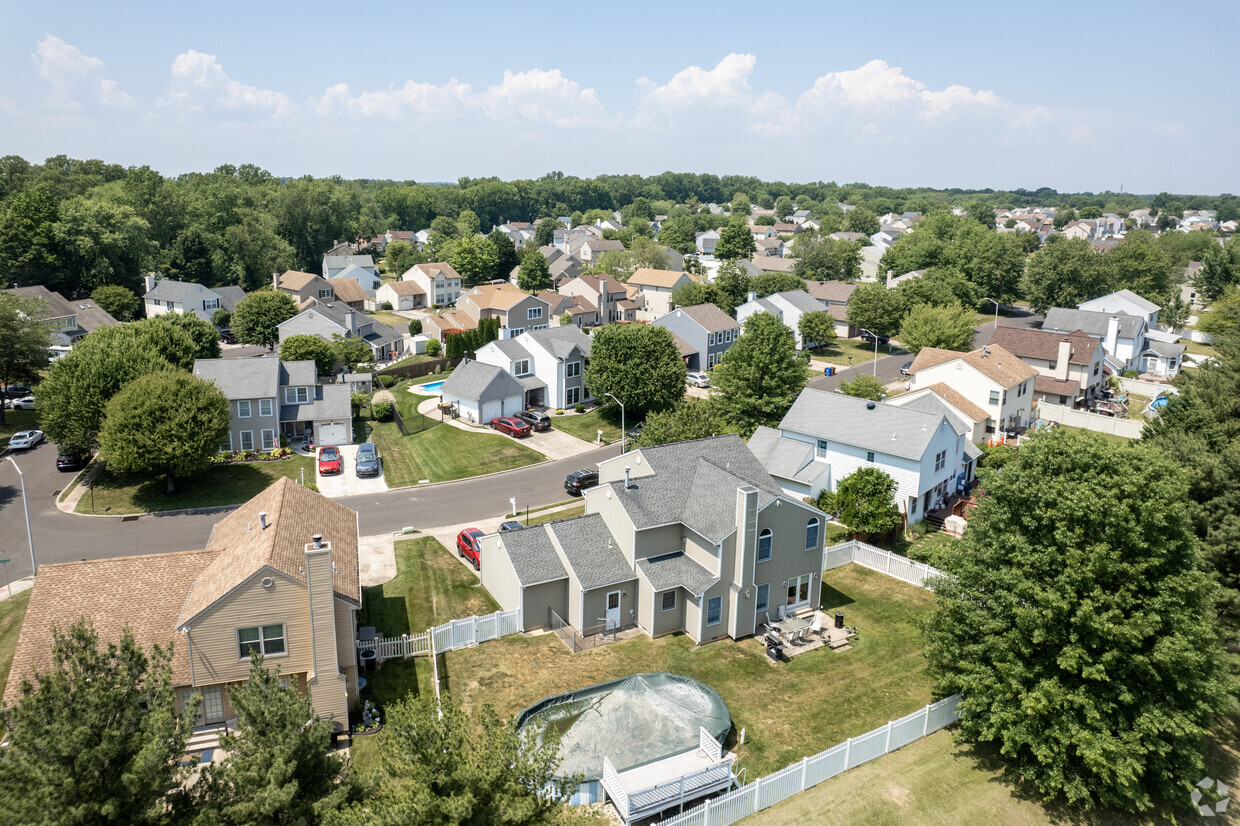
Home to an array of modern amenities and historic architecture, Bensalem is a charming community with a rich culture along the Delaware River. Located just 19 miles northeast of Philadelphia, residents can easily commute into the big city for work or leisure via Interstate 95.
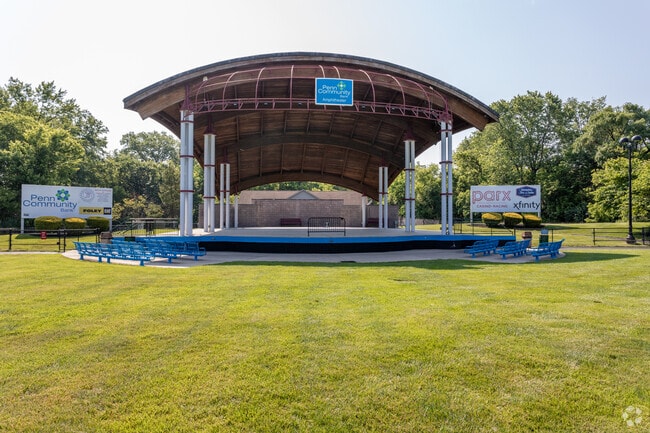
Within Bensalem, residents will find a family-friendly atmosphere, great schools, and parks like Neshaminy State Park. Bensalem residents enjoy a variety of exciting activities including concerts at Penn Community Bank Amphitheater, nightlife at the Parx Casino, and horse-racing at Parx Racing. More amenities in Bensalem include retail destinations like Marketplace at Neshaminy and Neshaminy Mall. The rest of Bensalem’s tree-lined streets consist of residential avenues. Apartments and houses in the area range from affordable to upscale, so there’s something for every renter in Bensalem.
Penn Community Bank Amphitheater holds summer concerts.
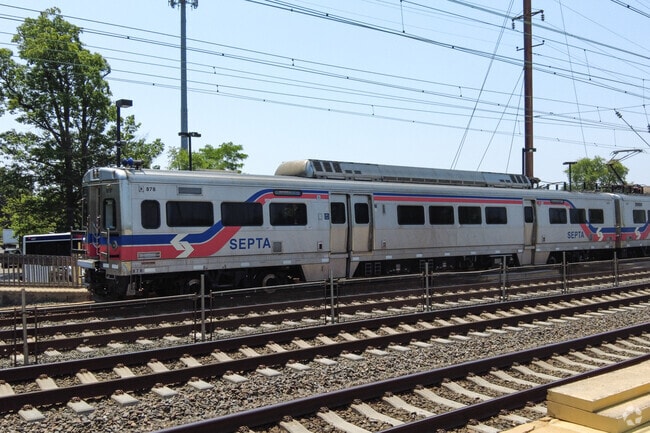
Bensalem residents have access to public transportation.
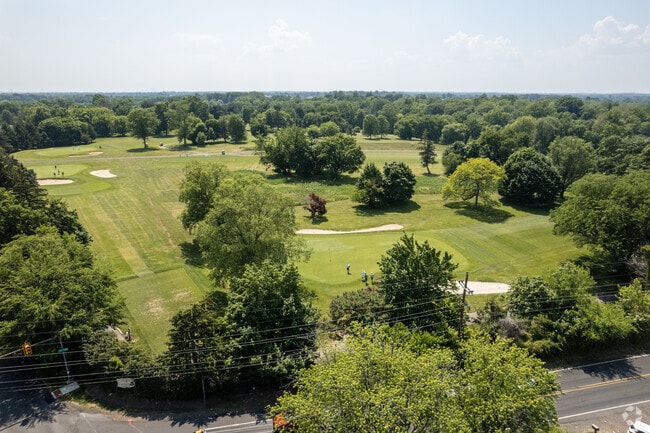
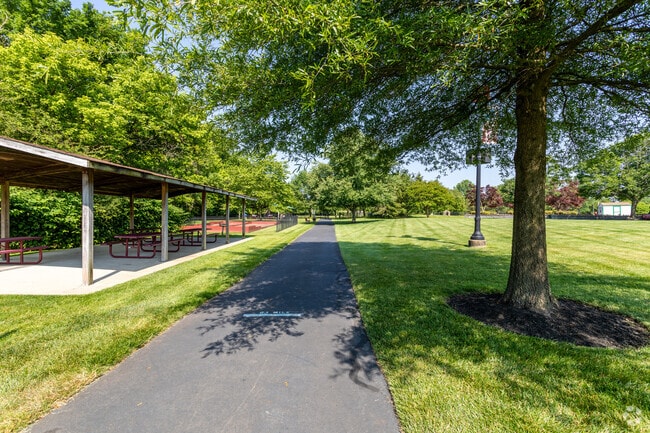
Bensalem Central Park has walking trails in Benslaem.
Walking path with benches and covered picnic areas in Bensalem Central Park.
Come swim at the pool at Neshaminy State Park in Bensalem.
Welcome sign at Neshaminy State Park in Bensalem.
Median Household Income
$76,165
Average: $98,859
Education
16,568
Residents Have a Degree
Job Market
34,689
Workers Employed
Median Age
43 Years
Largest Age Group
35-44 Years
Approximately 14% of Residents
Under 20
21%
Over 65
21%
Housing Distribution
Bensalem has more homeowners than renters.

Education Distribution
Review this city's overall education levels.

As of June 2026, the average apartment rent in Bensalem, PA is $1,275 for a studio, $1,469 for one bedroom, $1,772 for two bedrooms, and $2,397 for three bedrooms. Apartment rent in Bensalem has decreased by -0.1% in the past year.
Explore how walkable, bikeable, drivable, and transit-friendly Bensalem, PA is for everyday living.
Fairly Walkable
Walkability
Limited Public Transit
Transit
Exceptionally Drivable
Drivability
Fairly Bikeable
Bikeability
Public
Grades K-5
622 Students

Public
Grades K-5
499 Students
Public
Grades K-5
567 Students

Public
Grades K-5
553 Students
Public
Grades K-5
541 Students
Public
Grades 6-8
612 Students
Public
Grades 6-8
431 Students
Public
Grades K-12
1,324 Students

Public
Grades 9-12
2,120 Students
Public
Grades K-12
1,324 Students
† Our analysis of utilities, groceries, transportation, healthcare, home prices, and other goods and services is sourced from the Cost of Living Index, a respected benchmark published by the Council for Community and Economic Research (C2ER) that provides a thorough overview of living expenses across different regions.
Rent data is provided by CoStar Group’s Market Trend reports. As the industry leader in commercial real estate information, analytics, and news, CoStar conducts extensive research to produce and maintain a comprehensive database of commercial real estate information. We combine this data with public record to provide the most up-to-date rental information available.
Consumer goods, services, and home prices are sourced from the Cost of Living Index published by the Council for Community and Economic Research (C2ER). The data on this page is updated quarterly. It was last published in June 2026.
Demographic information comes from Neustar and combines detailed address data with U.S. Census and American Community Survey statistics to produce reliable local estimates.


