
Park Place Apartments
3928 Northwest Ave,
Bellingham, WA 98226
$1,695 - $2,470
Studio - 2 Beds

Between Mount Baker and Bellingham Bay, this Pacific Northwest city combines outdoor recreation with a welcoming downtown atmosphere. Western Washington University's campus brings energy to the community of 94,720 residents. The rental market remains steady, with average rents ranging from $1,342 for studios to $3,116 for four-bedroom units, showing year-over-year increases between 0.6% and 3.5%. The Fairhaven Historic District offers character-filled apartments near local shops, while downtown features converted industrial spaces now home to residential units.
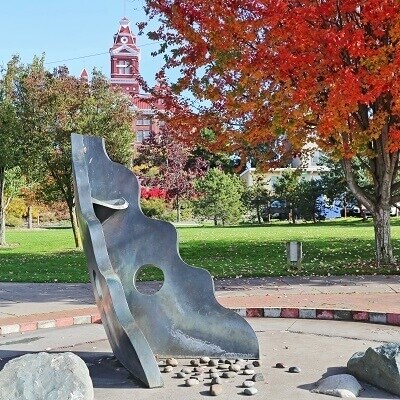
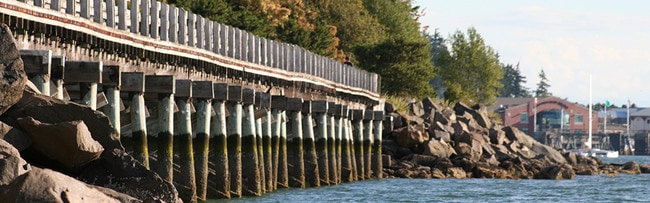
Whatcom Falls Park spans 241 acres with four waterfalls and an extensive trail network. The historic Mount Baker Theatre, dating to 1927, anchors the local arts scene. The waterfront district continues to expand with new residential developments and improved public spaces along Bellingham Bay. Located midway between Seattle and Vancouver, B.C., Bellingham offers easy access to both cities. The local brewing community includes established names like Boundary Bay Brewery, while community events like the annual Ski to Sea race showcase the region's recreational opportunities.
City Profile Image
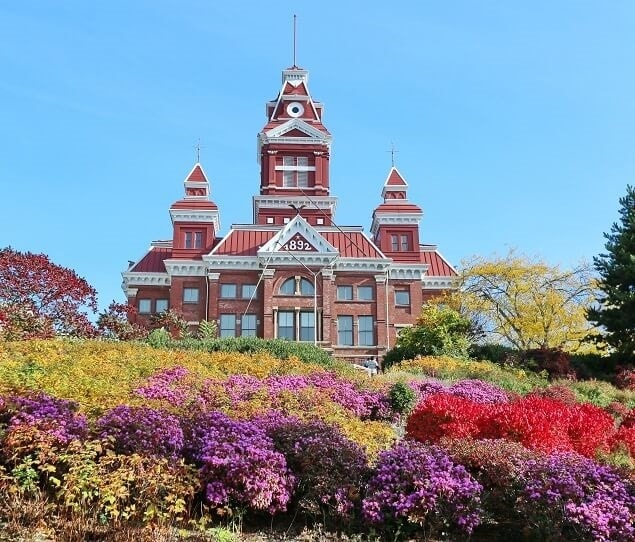
The historic Old City Hall, built in 1892, serves as the Whatcom Museum
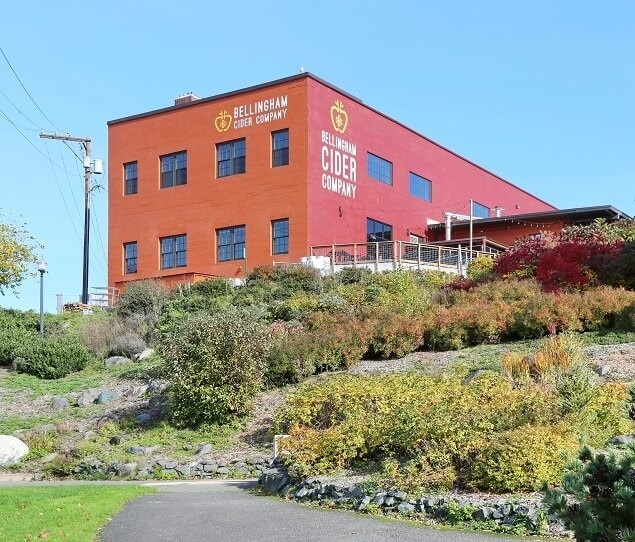
The Bellingham Cider Company, a craft cider producer and restaurant, is located in the Waterfront District
As of March 2026, the average apartment rent in Bellingham, WA is $1,390 for a studio, $1,557 for one bedroom, $1,872 for two bedrooms, and $2,335 for three bedrooms. Apartment rent in Bellingham has increased by 2.0% in the past year.
The cost of living in Bellingham, WA is 22.6% higher than the national average. Generally, housing in Bellingham is 38.7% more expensive than the national average, with rent falling between $1,390 - $2,335. You can expect to pay 6.8% more for groceries, 5.6% more for utilities, and 21.4% more for transportation.
Explore how walkable, bikeable, drivable, and transit-friendly Bellingham, WA is for everyday living.
Somewhat Walkable
You might be able to get out and walk when living in this area. Some errands can be accomplished on foot, but for others you’ll need a car.
Some Transit
You'll likely want a car when living in this area since it has few transit options.
Bikeable
While there’s some bike infrastructure in this area, you’ll still need a car for many errands.
Public
Grades PK-5

Public
Grades PK-5
Public
Grades PK-5
Public
Grades PK-5

Public
Grades PK-5

Public
Grades 6-8

Public
Grades 6-8

Public
Grades 6-8
Public
Grades 6-8
Public
Grades K-8

Public
Grades 9-12
Public
Grades 9-12
Public
Grades 9-12
Public
Grades 9-12

Public
Grades 6-12

34
Communities
2,300
Units
9
Cities

18
Communities
602
Units
4
Cities

51
Communities
10,995
Units
41
Cities

36
Communities
5,820
Units
33
Cities
61
Communities
7,033
Units
31
Cities

25
Communities
2,576
Units
20
Cities
† Our analysis of utilities, groceries, transportation, healthcare, home prices, and other goods and services is sourced from the Cost of Living Index, a respected benchmark published by the Council for Community and Economic Research (C2ER) that provides a thorough overview of living expenses across different regions.
Rent data is provided by CoStar Group’s Market Trend reports. As the industry leader in commercial real estate information, analytics, and news, CoStar conducts extensive research to produce and maintain a comprehensive database of commercial real estate information. We combine this data with public record to provide the most up-to-date rental information available.
Consumer goods, services, and home prices are sourced from the Cost of Living Index published by the Council for Community and Economic Research (C2ER). The data on this page is updated quarterly. It was last published in February 2026.


