Median Age
42 Years
Largest Age Group
30-39 Years
Approximately 13% of Residents
Under 20
22%
Over 65
22%

Avg Rent
$824
Population
24,859
Renter Mix
40% Rent
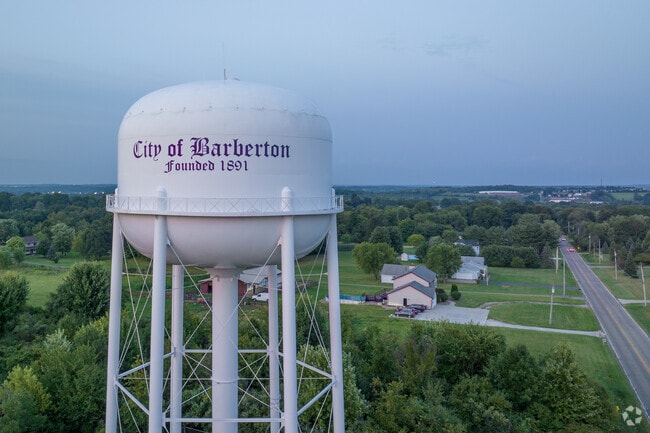
Barberton earned its nickname, "The Magic City," through purposeful design. Industrialist Ohio Columbus (O.C.) Barber founded it in 1891 with a clear plan: build factories, housing, and a thriving downtown all at once. That deliberate design still shows in the French Renaissance Revival architecture scattered across town, giving Barberton a character that most Ohio suburbs simply don't have.
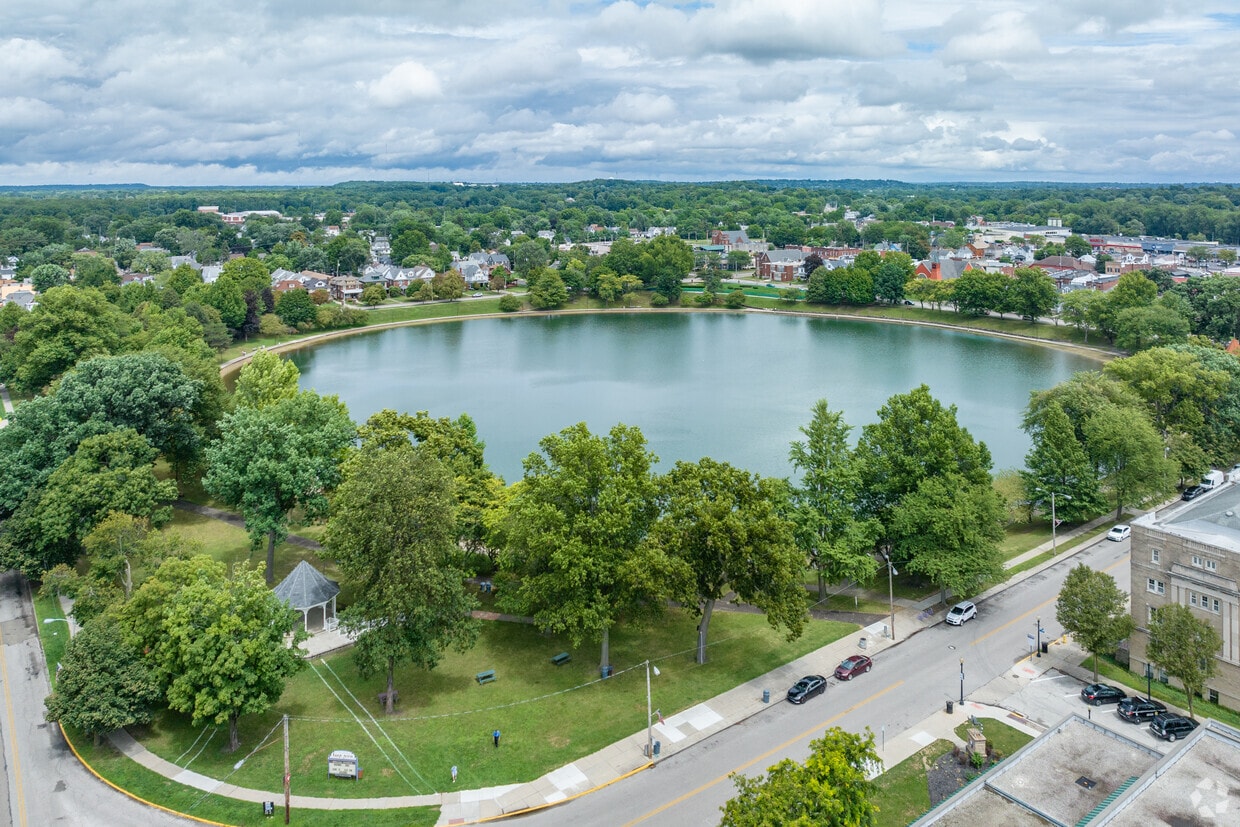
Sitting just southwest of Akron, the city puts downtown Akron within easy reach while maintaining its own identity. Lake Anna anchors the center of town, and every May the surrounding park fills with blooming cherry blossoms. The University of Akron is roughly eight miles away, adding an academic presence to the broader region.
The rental landscape here is practical and varied. Older brick apartment communities with classic Midwestern architecture sit alongside updated townhomes and garden-style rentals. Converted historic buildings occasionally offer loft-style spaces that reflect the city's industrial past. Whether you're looking for a spacious multi-bedroom unit or a compact one-bedroom, Barberton delivers solid options at a pace that feels refreshingly unhurried.
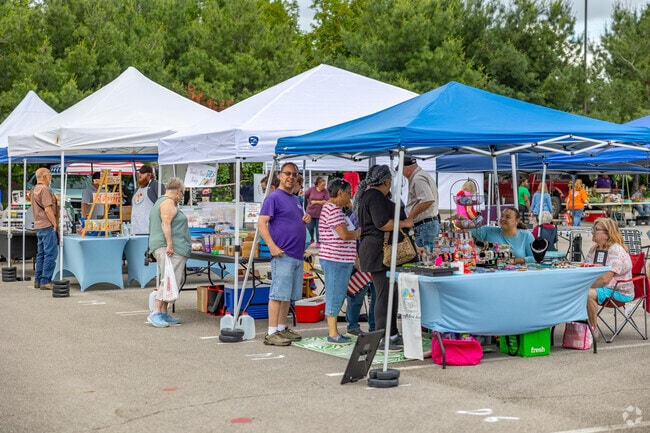
From homegrown foods to homemade products, it is all available at the Barberton Farmers Market.
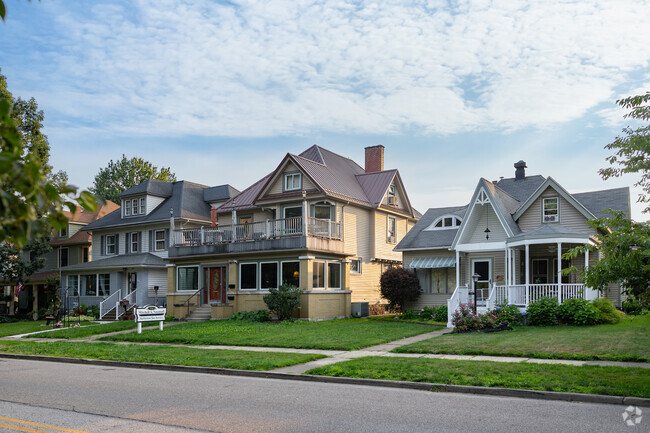
Traditional homes in Barberton are charming and well-kept.
Enjoy a conversation at Lake Anna in Barberton.
Citizens of Barberton have easy access to local amenities.
New designs are created every year at the Barberton Mum Festival at Lake Anna.
Catch up on some reading at Barberton Public Library.
Median Household Income
$46,701
Average: $59,923
Education
3,921
Residents Have a Degree
Job Market
11,347
Workers Employed
Median Age
42 Years
Largest Age Group
30-39 Years
Approximately 13% of Residents
Under 20
22%
Over 65
22%
Housing Distribution
Barberton has more homeowners than renters.

Education Distribution
Review this city's overall education levels.

As of July 2026, the average apartment rent in Barberton, OH is $824 for one bedroom, $844 for two bedrooms, and $1,060 for three bedrooms. Apartment rent in Barberton has increased by 4.2% in the past year.
Explore how walkable, bikeable, drivable, and transit-friendly Barberton, OH is for everyday living.
Fairly Walkable
Walkability
Limited Public Transit
Transit
Exceptionally Drivable
Drivability
Moderately Bikeable
Bikeability
Barberton Elementary School East
Public
Grades K-5
661 Students

Public
Grades K-8
725 Students

Public
Grades K-4
800 Students
Public
Grades K-5
673 Students

Public
Grades K-4
361 Students
Public
Grades K-8
725 Students
Public
Grades K-8
10 Students
Public
Grades 9-12
1,000 Students
† Our analysis of utilities, groceries, transportation, healthcare, home prices, and other goods and services is sourced from the Cost of Living Index, a respected benchmark published by the Council for Community and Economic Research (C2ER) that provides a thorough overview of living expenses across different regions.
Rent data is provided by CoStar Group’s Market Trend reports. As the industry leader in commercial real estate information, analytics, and news, CoStar conducts extensive research to produce and maintain a comprehensive database of commercial real estate information. We combine this data with public record to provide the most up-to-date rental information available.
Consumer goods, services, and home prices are sourced from the Cost of Living Index published by the Council for Community and Economic Research (C2ER). The data on this page is updated quarterly. It was last published in June 2026.
Demographic information comes from Neustar and combines detailed address data with U.S. Census and American Community Survey statistics to produce reliable local estimates.


