Median Age
43 Years
Largest Age Group
30-39 Years
Approximately 13% of Residents
Under 20
22%
Over 65
27%
Area Guide
Avg Rent
$1,202
Population
31,339
Renter Mix
32% Rent
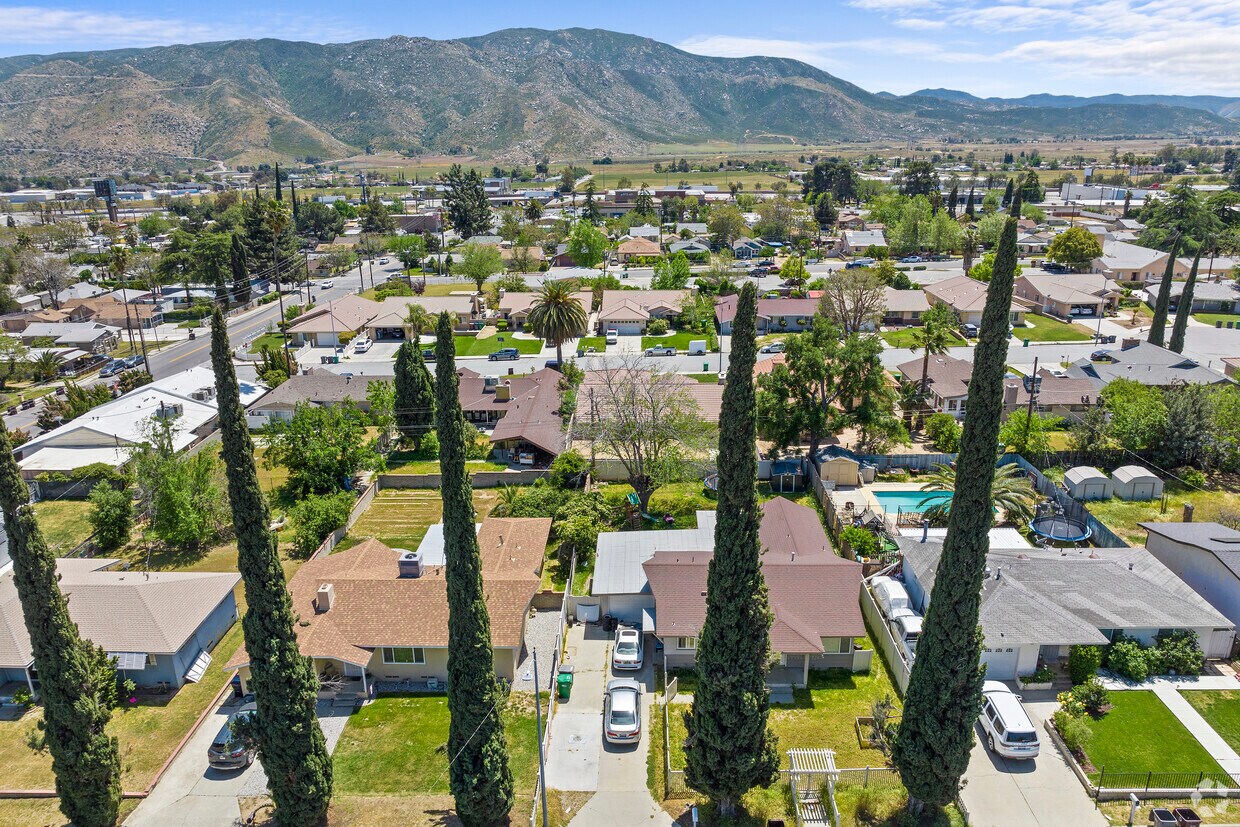
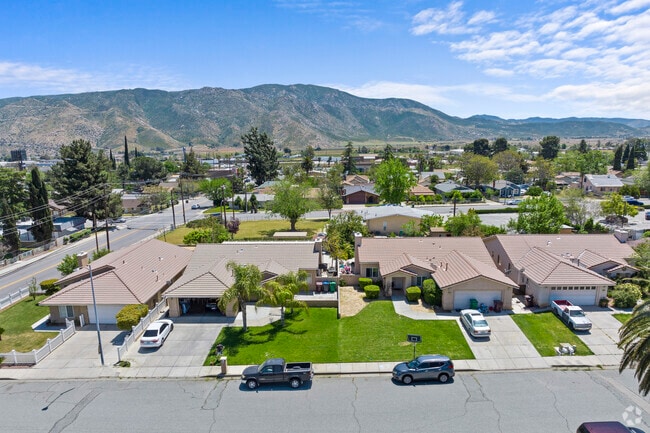
Situated between the Inland Empire and the Coachella Valley in the San Gorgonio Pass, Banning is a small town with stunning vistas of the two tallest peaks in southern California—Mount San Jacinto and Mount San Gorgonio. The Gilman Ranch Museum displays Banning’s rich history, which contributes to its modern-day spirit of pioneer ingenuity.
A bevy of local events brings the community together in Banning, including the popular Stagecoach Days, Thunder and Lightning Pow Wow, Concerts in the Park, and more. Convenience to numerous parks, hot springs, and casinos ensures there is always something to do near Banning as well. Getting around from Banning is easy with access to I-10 and I-215 in addition to Routes 60 and 79.
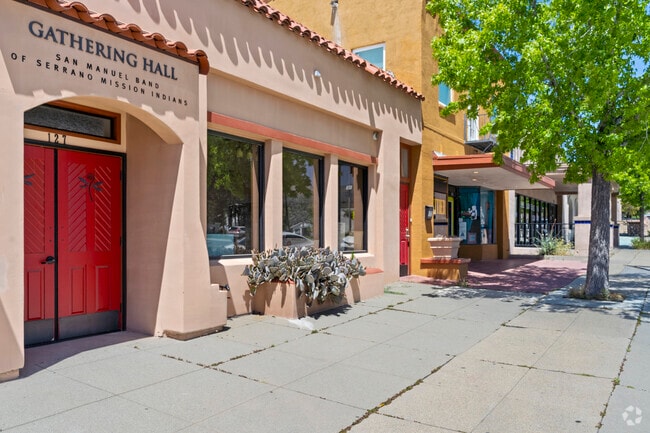
Experience the best of local shopping and dining on North San Gorgonio Ave Street in Banning.
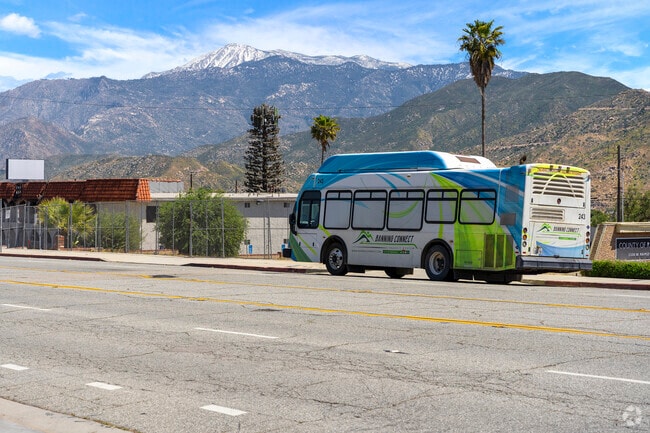
Experience the best of sustainable and eco-friendly transportation options in Banning.
Discover the beauty of Banning's stunning mountain views and scenery.
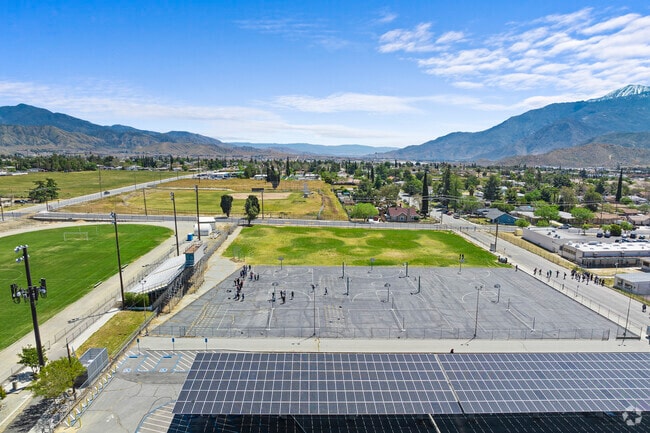
Watch the sun break through the clouds over Mias Canyon in Banning.
Mias Canyon can be seen from Banning.
Locals line up the street to enjoy a meal while on the go in Banning.
Median Household Income
$51,777
Average: $68,347
Education
4,970
Residents Have a Degree
Job Market
11,162
Workers Employed
Median Age
43 Years
Largest Age Group
30-39 Years
Approximately 13% of Residents
Under 20
22%
Over 65
27%
Housing Distribution
Banning has more homeowners than renters.

Education Distribution
Review this city's overall education levels.

As of June 2026, the average apartment rent in Banning, CA is $757 for a studio, $1,202 for one bedroom, $1,561 for two bedrooms, and $1,849 for three bedrooms. Apartment rent in Banning has increased by 3.1% in the past year.
Explore how walkable, bikeable, drivable, and transit-friendly Banning, CA is for everyday living.
Exceptionally Drivable
Drivability
Somewhat Bikeable
Bikeability
Public
Grades K-5
468 Students

Public
Grades K-5
468 Students
Public
Grades K-5
782 Students

Public
Grades K-5
782 Students
Public
Grades K-5
367 Students
Public
Grades 6-8
966 Students

Public
Grades 6-8
966 Students
Public
Grades 9-12
68 Students

Public
Grades 9-12
1,145 Students

Public
Grades 9-12
1,145 Students
Public
Grades 9-12
68 Students
† Our analysis of utilities, groceries, transportation, healthcare, home prices, and other goods and services is sourced from the Cost of Living Index, a respected benchmark published by the Council for Community and Economic Research (C2ER) that provides a thorough overview of living expenses across different regions.
Rent data is provided by CoStar Group’s Market Trend reports. As the industry leader in commercial real estate information, analytics, and news, CoStar conducts extensive research to produce and maintain a comprehensive database of commercial real estate information. We combine this data with public record to provide the most up-to-date rental information available.
Consumer goods, services, and home prices are sourced from the Cost of Living Index published by the Council for Community and Economic Research (C2ER). The data on this page is updated quarterly. It was last published in June 2026.
Demographic information comes from Neustar and combines detailed address data with U.S. Census and American Community Survey statistics to produce reliable local estimates.


