
Parkview at Spring Hill Apartments
1000 Springhill Dr,
Akron, OH 44312
$1,499 - $2,099
1-3 Beds
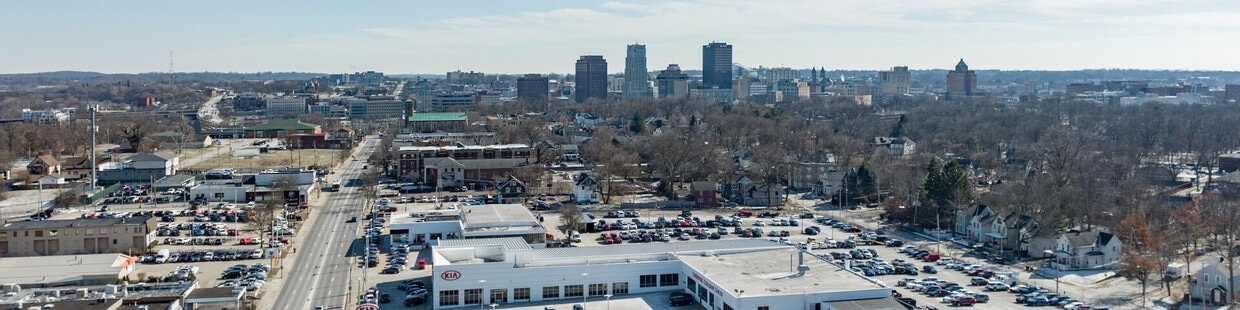


Welcome to Akron, where industrial heritage meets modern living. This former "Rubber Capital of the World" has transformed into a thriving city with diverse rental options throughout its neighborhoods. The rental market remains affordable, with one-bedroom apartments renting for $863, showing a 3.1% increase year-over-year. Two-bedroom units average $1,101, while larger three-bedroom homes typically rent for around $1,306. Notable areas include Highland Square, with its mix of historic architecture and local shops; Goodyear Heights, showcasing homes from the city's industrial era; and Merriman Valley, bordered by the Cuyahoga Valley National Park.
The city offers an array of recreational and cultural attractions. The Ohio and Erie Canal Towpath Trail winds through the area, connecting neighborhoods with 87 miles of paths for walking, running, and cycling. Downtown's Lock 3 Park hosts community events throughout the year, while the Stan Hywet Hall and Gardens preserves a magnificent Tudor Revival estate. The Akron Art Museum's distinctive steel and glass building houses an impressive collection of modern and contemporary art. The University of Akron campus adds to the city's educational landscape, while the surrounding polymer industry continues the city's legacy of innovation, hosting numerous research facilities and manufacturing centers.
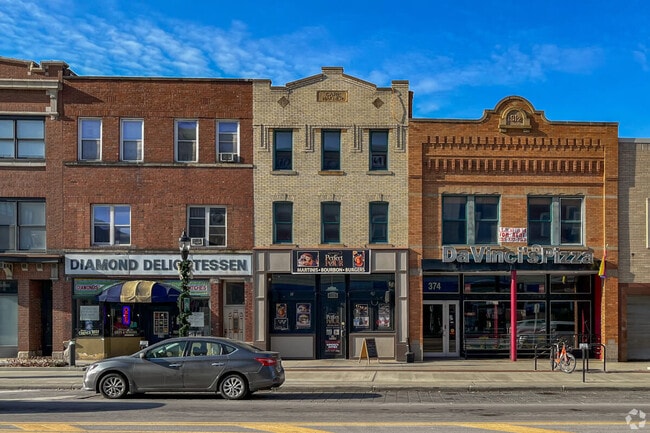
Downtown Akron is home to several locally owned restaurants.
Canal Park is baseball field that is home of the Akron RubberDucks in Downtown Akron.
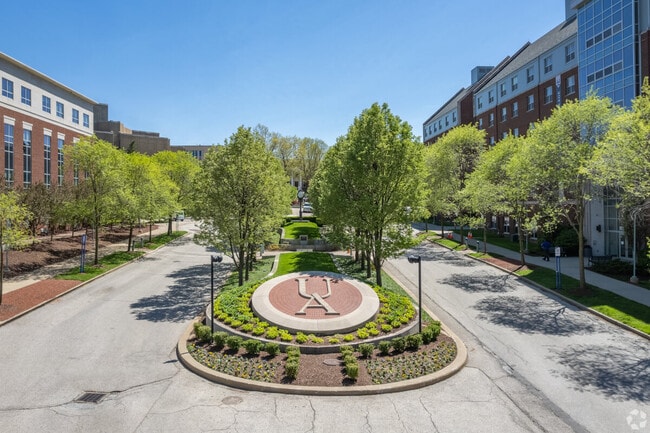
The ground signage of University of Akron is well kept and maintained in Downtown Akron.
As of March 2026, the average apartment rent in Akron, OH is $758 for a studio, $951 for one bedroom, $1,152 for two bedrooms, and $1,417 for three bedrooms. Apartment rent in Akron has increased by 2.3% in the past year.
The cost of living in Akron, OH is 15.2% lower than the national average. Generally, housing in Akron is 40.7% less expensive than the national average, with rent falling between $758 - $1,419. You can expect to pay 5.4% more for groceries, 19.5% less for utilities, and 1.8% more for transportation.
Explore how walkable, bikeable, drivable, and transit-friendly Akron, OH is for everyday living.
Somewhat Walkable
You might be able to get out and walk when living in this area. Some errands can be accomplished on foot, but for others you’ll need a car.
Some Transit
You'll likely want a car when living in this area since it has few transit options.
Somewhat Bikeable
You might be able to find places to ride your bike in this area, but you’ll most likely want your car for most errands.
Greater Summit County Early Learning Center
Public
Grades K-5

Public
Grades K-5

Public
Grades K-8
Public
Grades K-5
Case Community Learning Center
Public
Grades PK-5

Public
Grades K-8
Public
Grades 6-8
Miller-South Visual Performing Arts
Public
Grades K-8
Public
Grades K-8

Jennings Community Learning Center
Public
Grades 6-8

Public
Grades 9-12
Public
Grades 9-12
Ellet Community Learning Center
Public
Grades 9-12
Public
Grades 9-12
Public
Grades PK & 9-12

58
Communities
6,947
Units
30
Cities

27
Communities
7,462
Units
16
Cities

21
Communities
1,217
Units
11
Cities

315
Communities
76,967
Units
144
Cities
144
Communities
19,026
Units
116
Cities

61
Communities
9,932
Units
48
Cities
† Our analysis of utilities, groceries, transportation, healthcare, home prices, and other goods and services is sourced from the Cost of Living Index, a respected benchmark published by the Council for Community and Economic Research (C2ER) that provides a thorough overview of living expenses across different regions.
Rent data is provided by CoStar Group’s Market Trend reports. As the industry leader in commercial real estate information, analytics, and news, CoStar conducts extensive research to produce and maintain a comprehensive database of commercial real estate information. We combine this data with public record to provide the most up-to-date rental information available.
Consumer goods, services, and home prices are sourced from the Cost of Living Index published by the Council for Community and Economic Research (C2ER). The data on this page is updated quarterly. It was last published in February 2026.


