
Finding an apartment with real space to spread out often feels like it comes with a steep price tag, but new data from Apartments.com shows that's not always true. Across the U.S., some cities like Greenville, SC, and Charlotte, NC, offer renters the most space for their money, whether that means room for a home office or extra storage.
Square footage is only part of the picture. A big apartment doesn’t do you much good if it’s missing the amenities renters actually want or need.
Apartments.com ranked 50 major U.S. metro areas on space, rent, resident ratings, and amenities. Here's where renters get the most space for their money.
Key Takeaways
- The Greenville, South Carolina, metro area tops the list of the best cities for renters who want more space.
- The top 10 cities on this list charge 32% less for a four-bedroom apartment than the bottom 10 cities, on average.
- Renters in top-ranked metros are more than twice as likely to find a three-bedroom listing.
- Pet-friendly listings run 84% in the top 10 cities, compared with 54% in the bottom 10.
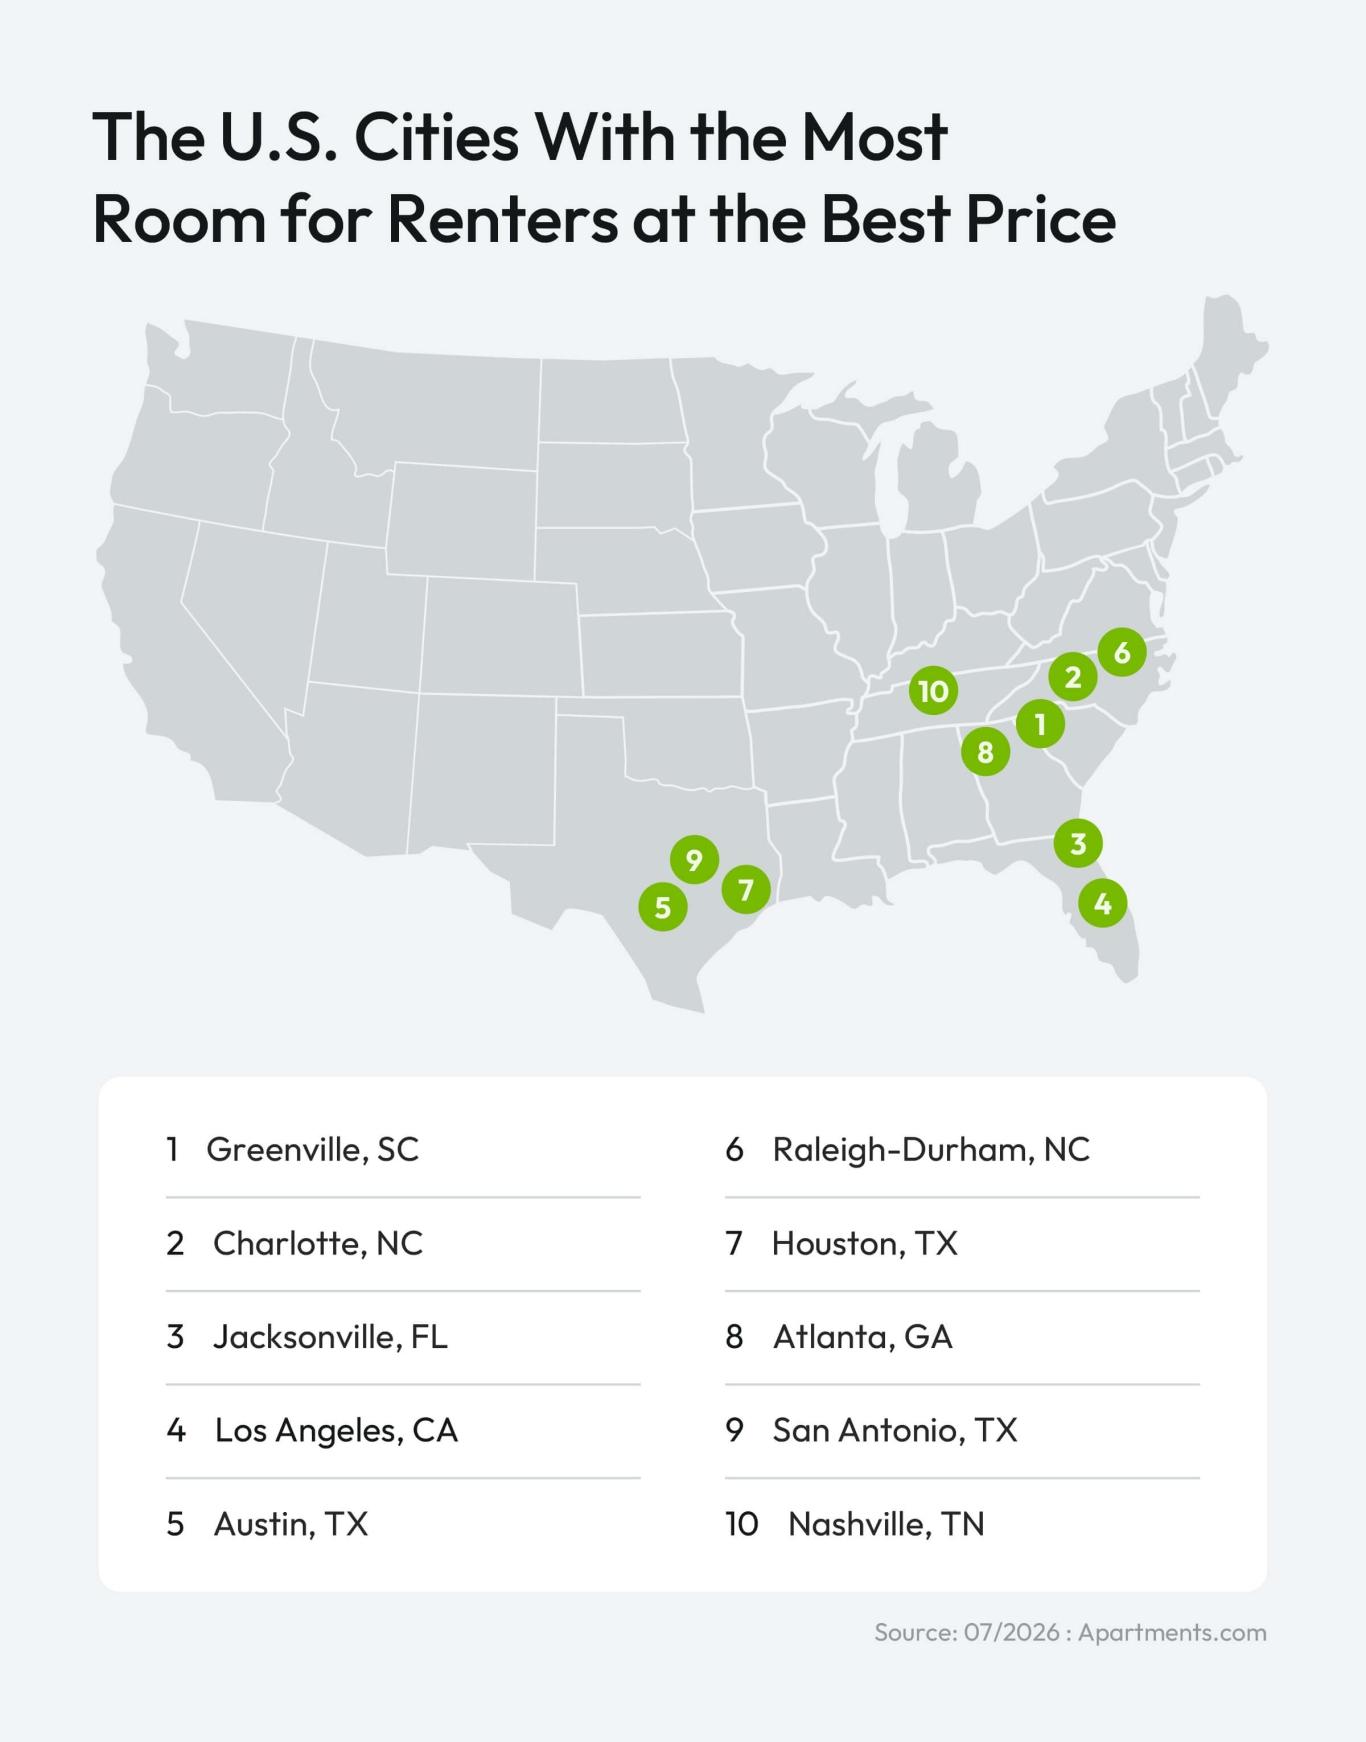
Cities Where Renters Get the Most Space for Their Money
No single number tells the whole story when it comes to finding a great rental. A cheap apartment isn't much of a win if it's tiny, and a big one isn't much of a win if it costs a fortune. So instead of ranking cities on price or size alone, we scored every metro area on six factors:
- The percentage of listings with three bedrooms
- The percentage of listings with four or more bedrooms
- Average rent for a three-bedroom apartment
- Average rent for a four-bedroom apartment
- The percentage of listings with amenities like elevators, pools, washers and dryers, pet-friendly policies, and security gates
- The average rating from current or past residents
Here's how the top 10 stack up:
|
Rank |
Metro Area |
% of rentals with 3BR |
% of rentals with 4+BR |
Avg 4BR rent |
Avg resident rating of the metro area |
|
1 |
Greenville, SC |
48% |
10% |
$2,135 |
3.75 |
|
2 |
Charlotte, NC |
49% |
8% |
$2,279 |
3.81 |
|
3 |
Jacksonville, FL |
53% |
8% |
$1,855 |
3.61 |
|
4 |
Orlando, FL |
52% |
9% |
$2,507 |
3.51 |
|
5 |
Austin, TX |
41% |
10% |
$2,087 |
3.55 |
|
6 |
Raleigh-Durham, NC |
46% |
5% |
$2,367 |
3.73 |
|
7 |
Houston, TX |
42% |
6% |
$1,902 |
3.54 |
|
8 |
Atlanta, GA |
48% |
8% |
$2,410 |
3.49 |
|
9 |
San Antonio, TX |
47% |
8% |
$1,608 |
3.36 |
|
10 |
Nashville, TN |
43% |
6% |
$1,914 |
3.66 |
Charlotte actually beats Greenville on resident ratings and core amenities, but Greenville's lower rent and slightly bigger share of four-bedroom listings is enough to put it at the very top. Together, these two cities make the Carolinas the strongest region on the list for renters who want space and amenities in the same package.
For comparison, here's how the bottom 10 stack up:
|
Rank |
Metro |
% of rentals with 3BR |
% of rentals with 4+BR |
Avg 4BR rent |
Avg resident rating of the metro area |
|
41 |
Chicago, IL |
23% |
5% |
$2,737 |
3.49 |
|
42 |
Boston, MA |
24% |
6% |
$3,897 |
3.60 |
|
43 |
Detroit, MI |
20% |
5% |
$2,195 |
3.33 |
|
44 |
Cincinnati, OH |
22% |
5% |
$2,368 |
3.35 |
|
45 |
Green Bay, WI |
18% |
1% |
$1,087 |
3.42 |
|
46 |
San Diego, CA |
19% |
2% |
$3,216 |
3.37 |
|
47 |
Los Angeles, CA |
16% |
2% |
$2,804 |
3.24 |
|
48 |
San Francisco, CA |
19% |
3% |
$3,386 |
3.31 |
|
49 |
Hartford, CT |
17% |
3% |
$3,675 |
3.23 |
|
50 |
New York, NY |
16% |
3% |
$5,529 |
3.32 |
A lot of these cities actually score well on things like elevators and washer/dryer access. They land near the bottom because space and affordability carry the most weight in the ranking.
Green Bay is one exception worth calling out; it has the cheapest four-bedroom rent in the entire study at only $1,087 a month, but it also has the lowest four-plus-bedroom share of any metro on the list, at just 1%, and its pool and gated-community numbers are some of the weakest around. Green Bay's low rent doesn't come with much extra room, and that combination is what keeps it near the bottom.
In Greenville, SC, Renters Get 3x the Four-Bedroom Listings for 61% Less Rent Than New York
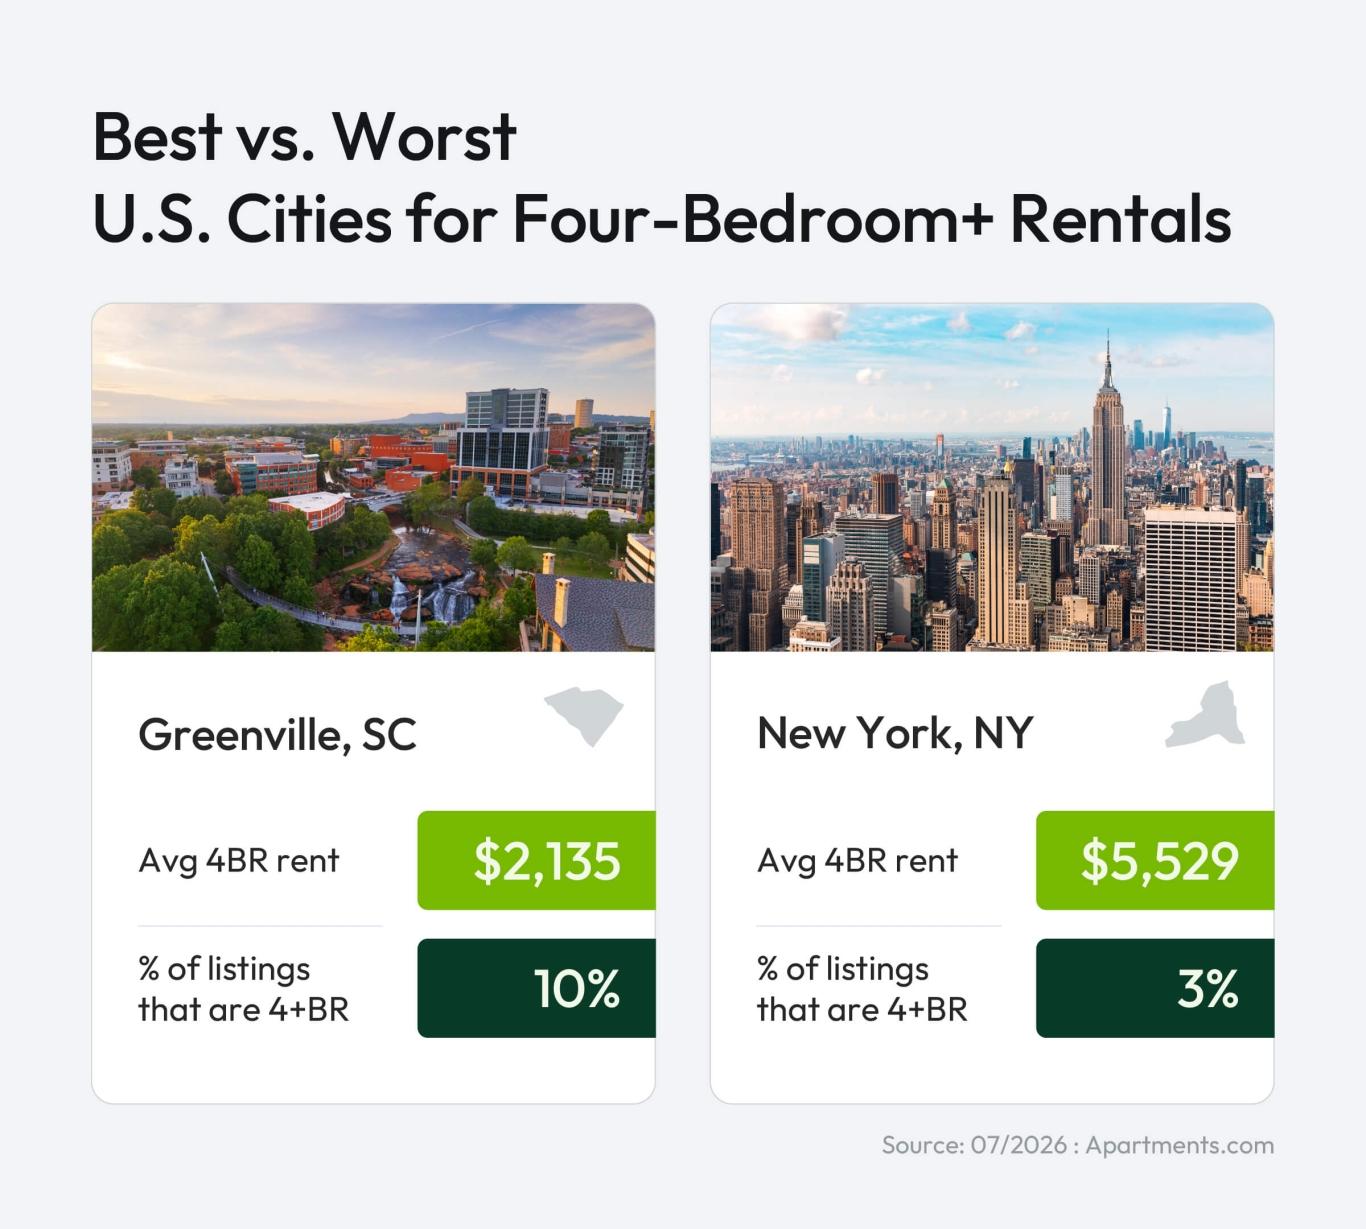
A four-bedroom apartment or larger in Greenville averages $2,135 a month. In New York, those same units average $5,529, a 61% increase. That difference alone makes Greenville one of the best deals in the country for renters who need extra room.
The savings don't stop at price. Greenville also has three times the share of four-bedroom listings compared with New York, at 10% versus just 3%. That share actually ties for the highest in the entire study, so renters have more four-bedroom options here than almost anywhere else in the country.
Put those two numbers together, and the picture gets clearer. On roughly the same budget, a renter in New York might only qualify for a studio apartment, while a renter in Greenville could land a four-bedroom with room to spare.
The savings don't stop at price. Greenville also has three times the share of four-bedroom listings compared with New York, at 10% versus just 3%. That share actually ties for the highest in the entire study, so renters have more four-bedroom options here than almost anywhere else in the country.
Put those two numbers together, and the picture gets clearer. On roughly the same budget, a renter in New York might only qualify for a studio apartment, while a renter in Greenville could land a four-bedroom with room to spare.
Top-Ranked Cities Offer 32% Cheaper Rent and Double the Three-Bedroom Availability
Renters in Charlotte pay $2,279 a month for a four-bedroom. In Jacksonville, it's just $1,855. Both numbers land well below the $3,089 average four-bedroom rent in the bottom 10 cities.
Averaged out, the top 10 metros run $2,106 a month for a four-bedroom, a 32% difference from the bottom 10. That $983 monthly difference adds up to nearly $11,800 a year.
Three-bedroom listings tell a similar story. In the top 10 cities, rent for a three-bedroom apartment averages $1,789 per month, and about 47% of listings are for three bedrooms. Compared to the bottom 10 cities’ average three-bedroom rent of $2,646 and listing availability of only around 19%, these top-ranked metros clearly have more room to offer.
In one of these cities, you’ll find more options and pay less for more room. Lower cost paired with more available space is what separates the top 10 from the rest of the list.
The Amenities Renters Want Most Are More Common in Top Cities, Too
Extra space matters, but so do the smaller things that make a rental a place you want to come home to, like a pool to cool off or a lease that welcomes your dog.
Access to pools shows up in nearly 75% of listings across the top 10, compared with just 32% in the bottom 10. Orlando leads the way at 83% of listings advertising pool access, with San Antonio close behind at 82%.
Pet policies show an even bigger difference. On average, about 84% of listings in the top 10 cities allow pets, compared with 54% of listings in the bottom 10. Houston tops the list at nearly 90% of listings being pet-friendly, with San Antonio right behind at 89.5%.
The same metros leading on space and rent also come out on top for these lifestyle amenities, so renters get both without settling for less in either category. Pool access in particular is usually part of the base rent rather than an added fee, so a lower monthly payment doesn't mean giving up that perk. Pet-friendly leases are more common in these cities, too, though pet rent or deposits can still apply on top of the base price.
How to Get More Space Without Overpaying
A lot of renters assume getting the space they want — whether it’s an extra bedroom for a new family member, a home office, or a room for your prized sports memorabilia — means buying a house or paying a premium to rent one in an expensive city. Buying isn't in reach for a lot of renters right now, and plenty of others simply prefer renting forever for the flexibility it offers.
The cities at the top of this list show it's possible to avoid that trade-off. In these markets, renters don't have to give up space to get a good price. Across the Southeast and Texas, renters can find larger units and better amenities without paying “big-city” rent.
Curious how far your current rent could go in a different city? Start your search on Apartments.com.
Methodology
For this report, every metropolitan area was scored using a 0–100 scale, calculated with min-max normalization across all 50 metros. The lowest metro in a category scores 0, the highest scores 100, and everything else lands in between.
|
Scoring Factor |
Weight |
Data Included |
|
Space |
30% |
|
|
Affordability |
25% |
|
|
Resident rating |
20% |
|
|
Core amenities |
20% |
|
|
Pool |
5% |
|
Throughout this data study, every metro area is referred to by a simplified, media-standard name (e.g., "Orlando" instead of "Orlando-Daytona Beach-Melbourne, FL"). The source data is reported at the Nielsen media market (DMA) level, and DMAs are drawn around broadcast signal reach rather than city limits, so most of them span multiple cities and, often, multiple states
The exact Nielsen market definitions behind each simplified name referenced in this study are:
- Greenville = Greenville-Spartanburg-Asheville-Anderson, NC-SC-GA
- Charlotte = Charlotte, NC-SC
- Jacksonville = Jacksonville, FL-GA
- Orlando = Orlando-Daytona Beach-Melbourne, FL
- Austin = Austin, TX
- Raleigh-Durham = Raleigh-Durham, NC-VA
- Houston = Houston, TX
- Atlanta = Atlanta, GA-AL-NC
- San Antonio = San Antonio, TX
- Nashville = Nashville, TN-KY
- Chicago = Chicago, IL-IN
- Boston = Boston (Manchester), MA-NH-VT
- Detroit = Detroit, MI
- Cincinnati = Cincinnati, OH-IN-KY
- Green Bay = Green Bay-Appleton, WI-MI
- San Diego = San Diego, CA
- Los Angeles = Los Angeles, CA-NV
- San Francisco = San Francisco-Oakland-San Jose, CA
- Hartford = Hartford-New Haven, CT
- New York = New York, NY-NJ-PA-CT


