
The Standard
1001 N Orange St,
Wilmington, DE 19801
$1,075 - $5,694
Studio - 3 Beds


Wilmington, Delaware's largest city, combines city living with historic architecture and character. Current rental trends show one-bedroom apartments averaging $1,563 per month and two-bedroom units at $1,764, reflecting yearly increases of 2.6% and 2.8% respectively. The city offers housing options from waterfront apartments to established neighborhoods like Trolley Square and The Highlands.
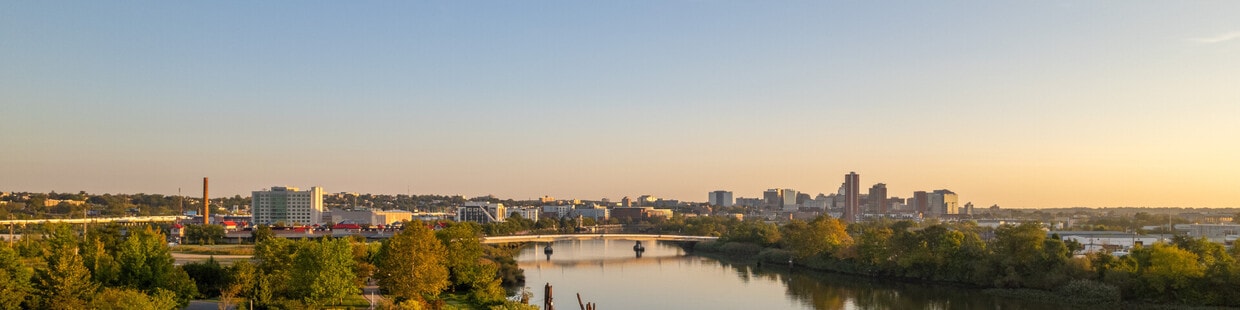
The Riverfront district stands as the city's entertainment hub, featuring the popular Riverwalk, restaurants, and recreation areas. Residents have access to substantial parkland, including Brandywine Park with its walking trails and Rockford Park's open spaces. The Delaware Art Museum and Grand Opera House represent the city's commitment to the arts, while historic districts like Quaker Hill and Little Italy preserve local heritage. Widener University Delaware Law School maintains a campus in the city, and downtown Wilmington's financial district houses major banking institutions and corporate offices. Community events dot the calendar, from the summer Italian Festival to the Clifford Brown Jazz Festival.
Brandywine Festival of the Arts takes place in Brandywine Park.
Take a stroll along the Wilmington Riverfront, just a few minute drive from Highlands.
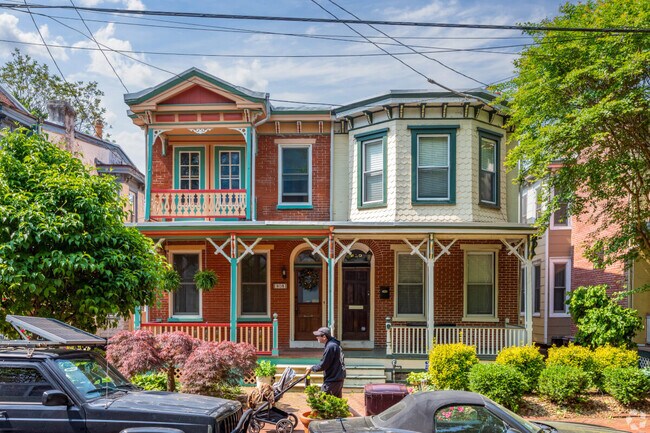
Colorful twin homes are common in Downtown Wilmington.
As of March 2026, the average apartment rent in Wilmington, DE is $1,360 for a studio, $1,581 for one bedroom, $1,781 for two bedrooms, and $2,127 for three bedrooms. Apartment rent in Wilmington has increased by 1.4% in the past year.
The cost of living in Wilmington, DE is 4.1% higher than the national average. Generally, housing in Wilmington is 0.6% less expensive than the national average, with rent falling between $1,359 - $2,130. You can expect to pay 5.4% more for groceries, 2.4% more for utilities, and 8.2% more for transportation.
Explore how walkable, bikeable, drivable, and transit-friendly Wilmington, DE is for everyday living.
Somewhat Walkable
You might be able to get out and walk when living in this area. Some errands can be accomplished on foot, but for others you’ll need a car.
Some Transit
You'll likely want a car when living in this area since it has few transit options.
Somewhat Bikeable
You might be able to find places to ride your bike in this area, but you’ll most likely want your car for most errands.
Public
Grades K-5

Public
Grades K-5

Public
Grades K-5
Public
Grades K-5

Public
Grades K-5
Public
Grades 6-12
Public
Grades K-12

Public
Grades K-8

Public
Grades 6-8
Public
Grades K-8
Public
Grades 9-12
Public
Grades 9-12
Public
Grades 9-12
Public
Grades 6-12
Public
Grades K-12

33
Communities
6,881
Units
8
Cities

10
Communities
1,638
Units
4
Cities

38
Communities
7,683
Units
16
Cities

14
Communities
908
Units
9
Cities

54
Communities
9,317
Units
30
Cities

18
Communities
2,537
Units
12
Cities
† Our analysis of utilities, groceries, transportation, healthcare, home prices, and other goods and services is sourced from the Cost of Living Index, a respected benchmark published by the Council for Community and Economic Research (C2ER) that provides a thorough overview of living expenses across different regions.
Rent data is provided by CoStar Group’s Market Trend reports. As the industry leader in commercial real estate information, analytics, and news, CoStar conducts extensive research to produce and maintain a comprehensive database of commercial real estate information. We combine this data with public record to provide the most up-to-date rental information available.
Consumer goods, services, and home prices are sourced from the Cost of Living Index published by the Council for Community and Economic Research (C2ER). The data on this page is updated quarterly. It was last published in February 2026.


