Median Age
42 Years
Largest Age Group
35-44 Years
Approximately 14% of Residents
Under 20
22%
Over 65
22%

Avg Rent
$1,237
Population
32,280
Renter Mix
34% Rent
Located about 30 miles northwest of Milwaukee, West Bend combines big-city amenities with small-town charm in one of Wisconsin’s most scenic environments, the Kettle Moraine. Known as the Geocaching Capital of the Midwest, West Bend is a favorite destination for treasure hunters with more than 450 caches within a seven-mile radius.
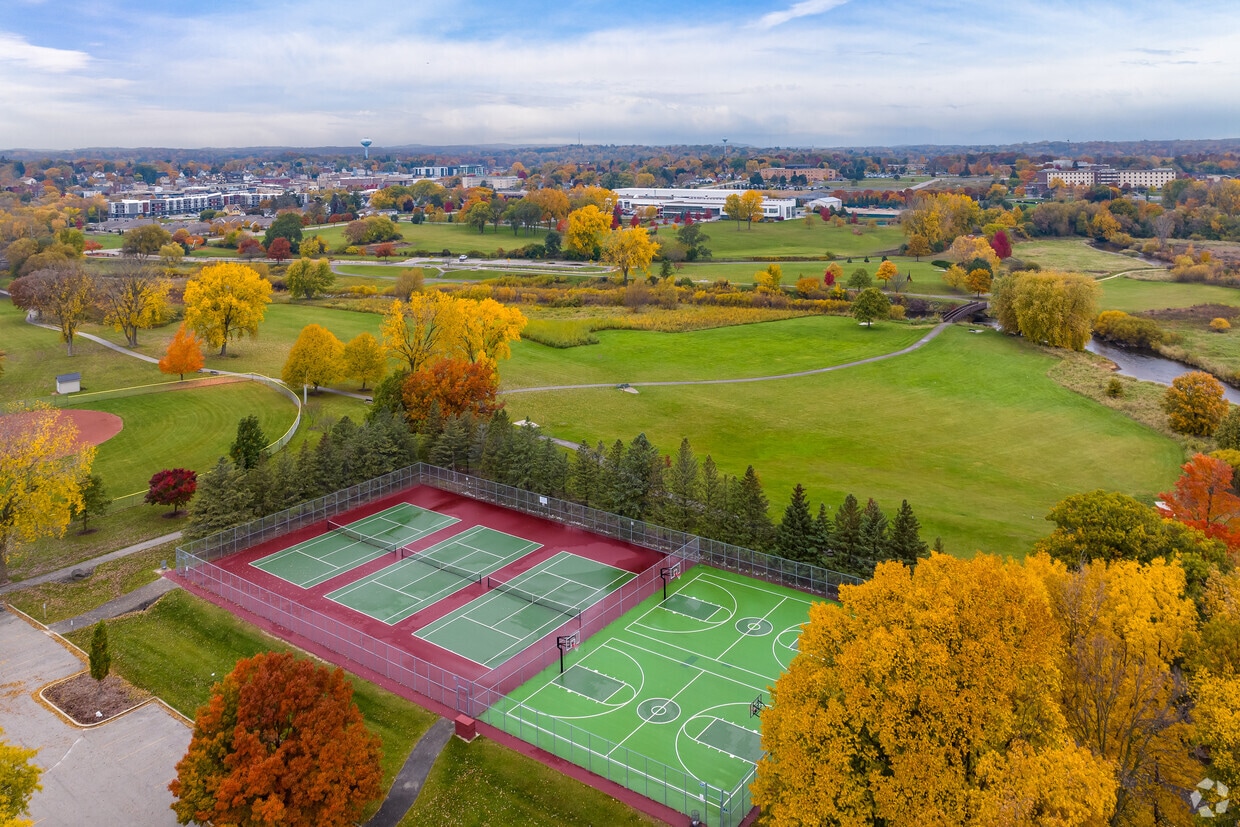
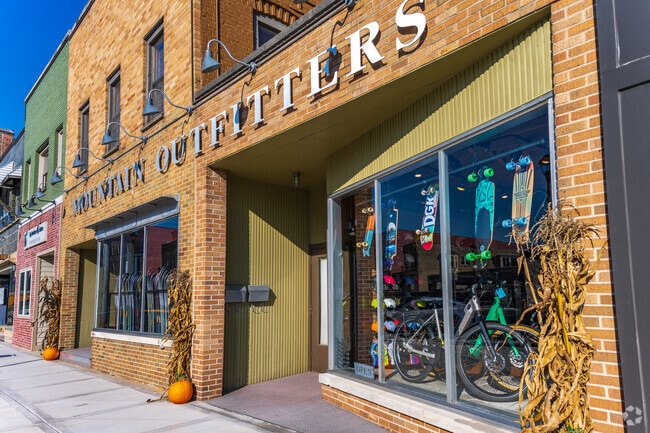
Access to over 1200 acres of parks, the Milwaukee River, and numerous nearby lakes makes West Bend a haven for outdoor recreation. West Bend’s historic downtown area stretches along Main Street with an abundance of locally owned shops, restaurants, offices, and venues in charming, old-fashioned buildings. Regular events in Downtown West Bend bring the community together, including the famous weekly farmers market, Music on Main, Fall Fest, and the West Bend Bike Race.
A children's boutique in Downtown West Bend.
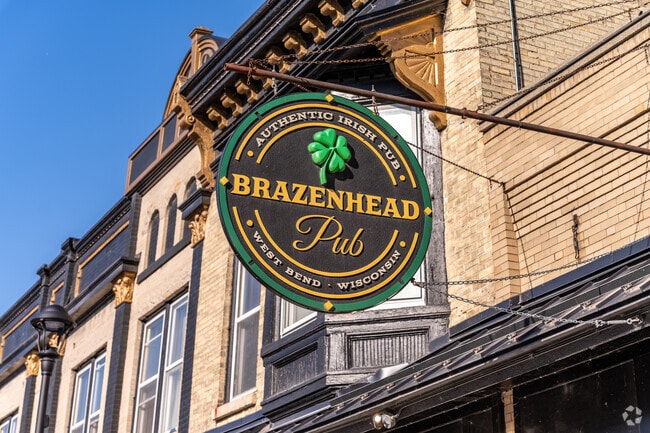
The Brazenhead Pub in Downtown West Bend, is a great place to stop for a pint and meal.
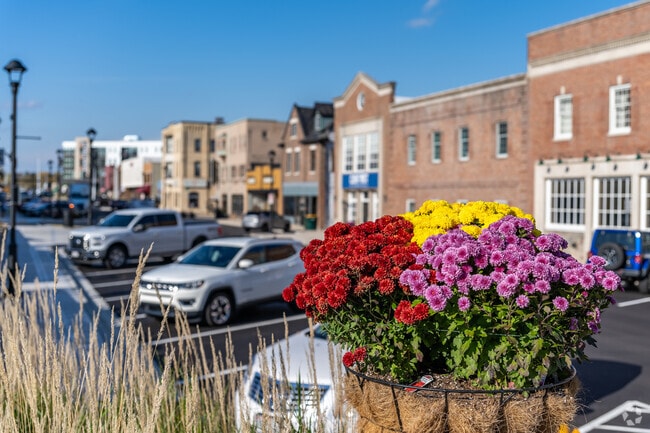
Colorful fall flowers on Main St. in Downtown West Bend.
Crossing a pedestrian bridge in Downtown West Bend.
A vibrant garden of trees in Downtown West Bend.
A great wooded picnic area at Riverside Park in West Bend.
Median Household Income
$68,719
Average: $82,109
Education
7,979
Residents Have a Degree
Job Market
17,598
Workers Employed
Median Age
42 Years
Largest Age Group
35-44 Years
Approximately 14% of Residents
Under 20
22%
Over 65
22%
Housing Distribution
West Bend has more homeowners than renters.

Education Distribution
Review this city's overall education levels.

As of July 2026, the average apartment rent in West Bend, WI is $1,069 for a studio, $1,237 for one bedroom, $1,315 for two bedrooms, and $1,653 for three bedrooms. Apartment rent in West Bend has increased by 2.9% in the past year.
Explore how walkable, bikeable, drivable, and transit-friendly West Bend, WI is for everyday living.
Fairly Walkable
Walkability
Exceptionally Drivable
Drivability
Moderately Bikeable
Bikeability
Public
Grades K-5
718 Students

Public
Grades K-5
379 Students
Public
Grades K-5
372 Students
Public
Grades K-5
372 Students
Public
Grades K-5
334 Students
Public
Grades 6-8
714 Students

Public
Grades 6-8
851 Students

Public
Grades K-12
5 Students

Public
Grades 9-12
1,075 Students

Public
Grades 9-12
1,075 Students
Public
Grades 9-12
965 Students
Public
Grades 9-12
965 Students
Public
Grades K-12
5 Students
† Our analysis of utilities, groceries, transportation, healthcare, home prices, and other goods and services is sourced from the Cost of Living Index, a respected benchmark published by the Council for Community and Economic Research (C2ER) that provides a thorough overview of living expenses across different regions.
Rent data is provided by CoStar Group’s Market Trend reports. As the industry leader in commercial real estate information, analytics, and news, CoStar conducts extensive research to produce and maintain a comprehensive database of commercial real estate information. We combine this data with public record to provide the most up-to-date rental information available.
Consumer goods, services, and home prices are sourced from the Cost of Living Index published by the Council for Community and Economic Research (C2ER). The data on this page is updated quarterly. It was last published in June 2026.
Demographic information comes from Neustar and combines detailed address data with U.S. Census and American Community Survey statistics to produce reliable local estimates.


