Median Age
46 Years
Largest Age Group
55-64 Years
Approximately 16% of Residents
Under 20
21%
Over 65
22%


Avg Rent
$2,887
Population
25,028
Renter Mix
13% Rent
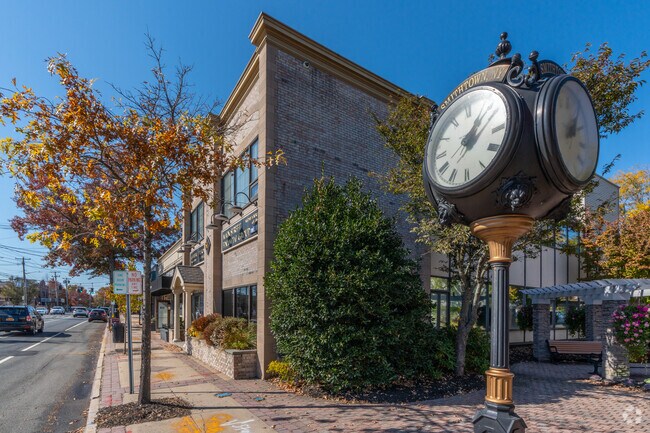
Smithtown sits on the North Shore of Long Island with a founding legend involving a bull, a rider, and the longest day of the year — and that bull statue still stands near the center of town today. Part of Suffolk County and the broader New York metropolitan area, Smithtown carries a distinctly suburban character with deep historical roots dating to 1665. The town encompasses incorporated villages and unincorporated hamlets, giving it a layered sense of place rather than one uniform identity. Nearby Hauppauge supports a notable commercial and business corridor, while the Long Island Rail Road station connects residents to New York City for work or recreation. Stony Brook University lies a short drive west, adding an academic presence to the region. The housing mix leans toward single-family homes, though apartment communities and townhome rentals offer alternatives for those who prefer low-maintenance living. Caleb Smith State Park provides quiet wooded trails within the town's borders. With a strong school system, accessible commuter infrastructure, and a community that takes its local history seriously, Smithtown offers a grounded, well-established place to put down roots on Long Island.
627-acre Blydenburgh County Park offers visitors panoramic views.
Median Household Income
$154,712
Average: $178,710
Education
10,009
Residents Have a Degree
Job Market
13,258
Workers Employed
Median Age
46 Years
Largest Age Group
55-64 Years
Approximately 16% of Residents
Under 20
21%
Over 65
22%
Housing Distribution
Smithtown has more homeowners than renters.

Education Distribution
Review this city's overall education levels.

As of July 2026, the average apartment rent in Smithtown, NY is $2,135 for a studio, $2,887 for one bedroom, $3,461 for two bedrooms, and $3,859 for three bedrooms. Apartment rent in Smithtown has increased by 2.3% in the past year.
Explore how walkable, bikeable, drivable, and transit-friendly Smithtown, NY is for everyday living.
Fairly Walkable
Walkability
Minimal Public Transit
Transit
Exceptionally Drivable
Drivability
Somewhat Bikeable
Bikeability
Public
Grades PK-5
498 Students

Mount Pleasant Elementary School
Public
Grades K-5
479 Students
Branch Brook Elementary School
Public
Grades K-5
374 Students
Public
Grades K-5
350 Students
Public
Grades K-5
523 Students

Public
Grades 6-8
522 Students

Public
Grades 9-12
1,158 Students

† Our analysis of utilities, groceries, transportation, healthcare, home prices, and other goods and services is sourced from the Cost of Living Index, a respected benchmark published by the Council for Community and Economic Research (C2ER) that provides a thorough overview of living expenses across different regions.
Rent data is provided by CoStar Group’s Market Trend reports. As the industry leader in commercial real estate information, analytics, and news, CoStar conducts extensive research to produce and maintain a comprehensive database of commercial real estate information. We combine this data with public record to provide the most up-to-date rental information available.
Consumer goods, services, and home prices are sourced from the Cost of Living Index published by the Council for Community and Economic Research (C2ER). The data on this page is updated quarterly. It was last published in June 2026.
Demographic information comes from Neustar and combines detailed address data with U.S. Census and American Community Survey statistics to produce reliable local estimates.


