
1100 Penn Avenue
1100 Penn Ave,
Scranton, PA 18509
$1,425 - $2,800
Studio - 2 Beds
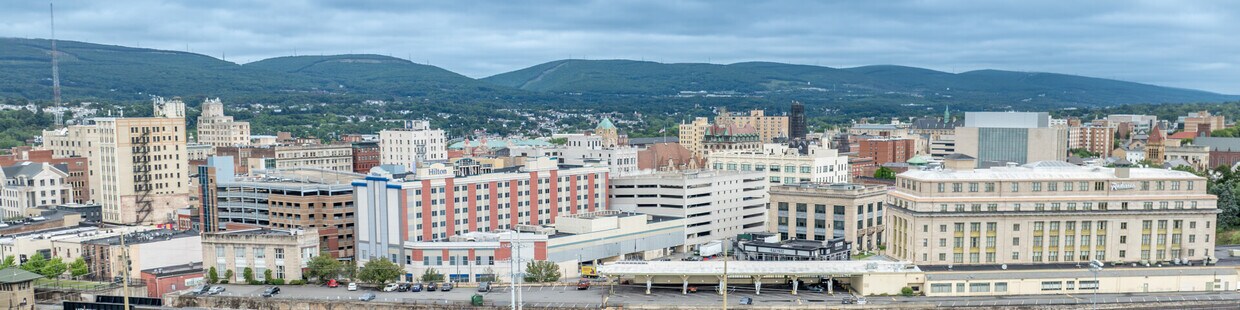


Welcome to Scranton, Pennsylvania! Known as the Electric City, Scranton offers residents a mix of historic charm and modern living. Average rent for a one-bedroom apartment currently stands at $1,254 (showing a 2.9% annual increase). Downtown features architectural treasures like the Lackawanna County Courthouse and the restored Radisson Lackawanna Station Hotel. Nay Aug Park provides outdoor recreation with its walking trails and scenic gorge. The city's residential areas include the Hill and Green Ridge sections, known for their historic homes, while downtown features contemporary apartment communities. The University of Scranton campus adds to the area's energy, and the Steamtown National Historic Site preserves the region's railroad legacy.
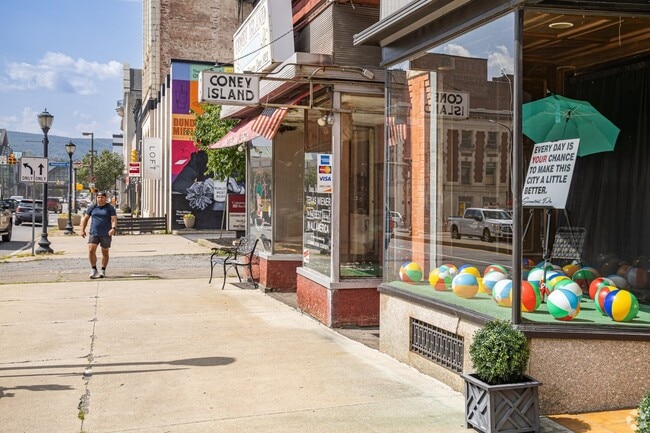
The Scranton Cultural Center, housed in the former Masonic Temple, hosts performances and events throughout the year. The city celebrates its heritage through annual traditions like La Festa Italiana in courthouse square and the St. Patrick's Day Parade, one of the largest in the nation. Downtown Scranton continues to grow with locally owned shops and restaurants. Current rental options include two-bedroom units averaging $1,470 and three-bedroom homes at approximately $1,248.
Shops and restaurants are located beneath apartments in Downtown Scranton.
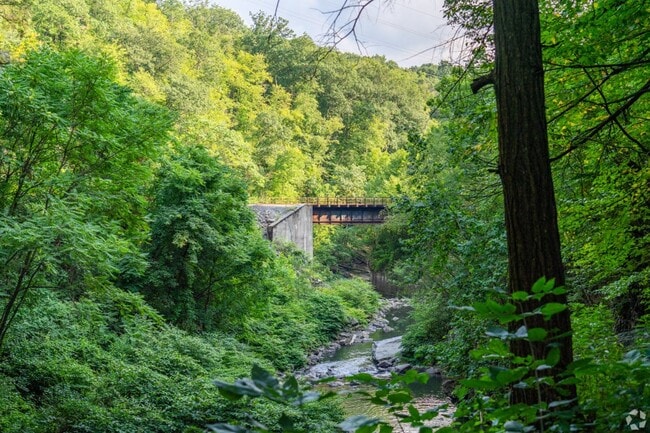
Nay Aug Park is an escape from the city that isn't far from Scranton.
Scranton was the first city in America to have completely electric street cars.
As of March 2026, the average apartment rent in Scranton, PA is $1,240 for a studio, $1,339 for one bedroom, $1,517 for two bedrooms, and $1,267 for three bedrooms. Apartment rent in Scranton has increased by 2.8% in the past year.
The cost of living in Scranton, PA is 10.5% lower than the national average. Generally, housing in Scranton is 37.1% less expensive than the national average, with rent falling between $1,240 - $1,517. You can expect to pay 2.2% less for groceries, 3.4% more for utilities, and 1.1% more for transportation.
Explore how walkable, bikeable, drivable, and transit-friendly Scranton, PA is for everyday living.
Moderately walkable
Walkability
Exceptionally drivable
Drivability
Fairly bikeable
Bikeability
Public
Grades PK-5

Public
Grades K-5

Public
Grades K-5

Public
Grades PK-5
South Scranton Intermediate School
Public
Grades K-8
Public
Grades 6-12
South Scranton Intermediate School
Public
Grades K-8
HOWARD GARDNER MULTIPLE INTELL
Public
Grades K-8
Public
Grades 6-8

Public
Grades K-8
Public
Grades 6-12
Public
Grades 9-12
Public
Grades 9-12


64
Communities
7,628
Units
54
Cities

25
Communities
4,472
Units
19
Cities

391
Communities
108,446
Units
239
Cities

58
Communities
17,295
Units
35
Cities

37
Communities
3,842
Units
30
Cities

21
Communities
3,053
Units
16
Cities
† Our analysis of utilities, groceries, transportation, healthcare, home prices, and other goods and services is sourced from the Cost of Living Index, a respected benchmark published by the Council for Community and Economic Research (C2ER) that provides a thorough overview of living expenses across different regions.
Rent data is provided by CoStar Group’s Market Trend reports. As the industry leader in commercial real estate information, analytics, and news, CoStar conducts extensive research to produce and maintain a comprehensive database of commercial real estate information. We combine this data with public record to provide the most up-to-date rental information available.
Consumer goods, services, and home prices are sourced from the Cost of Living Index published by the Council for Community and Economic Research (C2ER). The data on this page is updated quarterly. It was last published in February 2026.


