
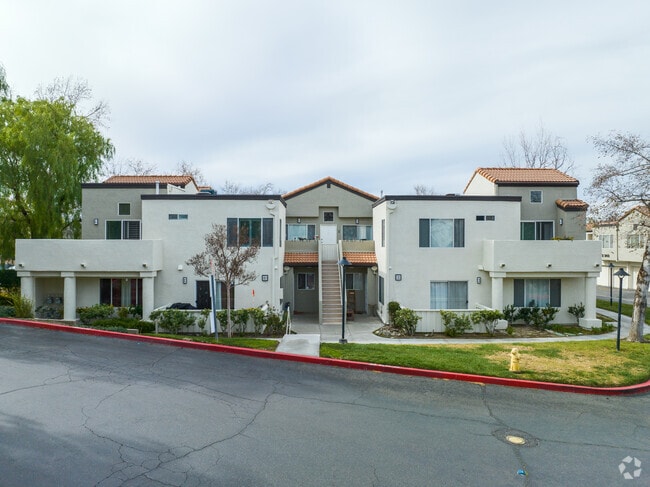
The Retreat
22900 Oak Ridge Dr,
Santa Clarita, CA 91350
$2,250 - $3,200
1-3 Beds
Santa Clarita combines suburban living with outdoor recreation in a valley setting 30 miles northwest of downtown Los Angeles. The city features over 77 miles of hiking and biking trails connecting neighborhoods. Central Park in Saugus offers sports fields, a community garden, and a disc golf course. Current rental trends show average rents ranging from $1,852 for studios to $3,419 for three-bedroom units, with options spanning apartment communities and single-family homes. The area includes Valencia with its extensive paseo system and Valencia Town Center mall, Canyon Country with mountain vistas, and the historic Old Town Newhall district.
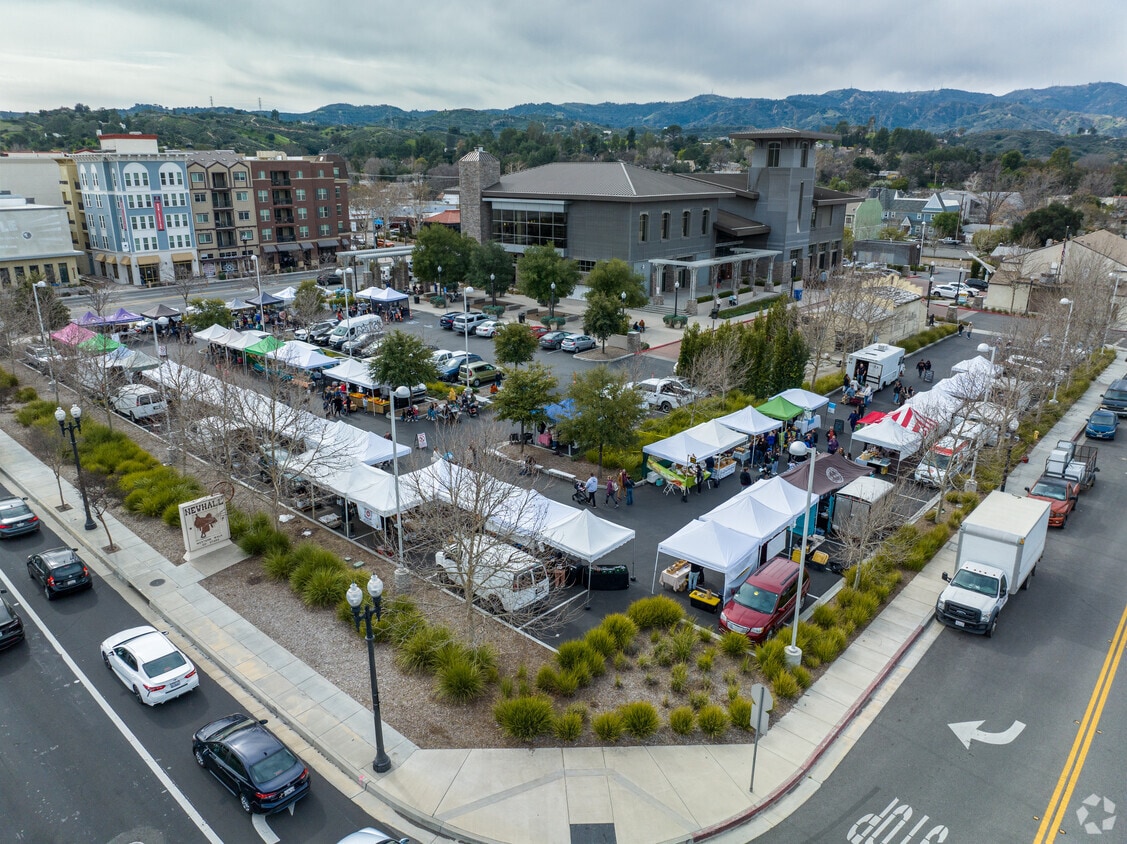
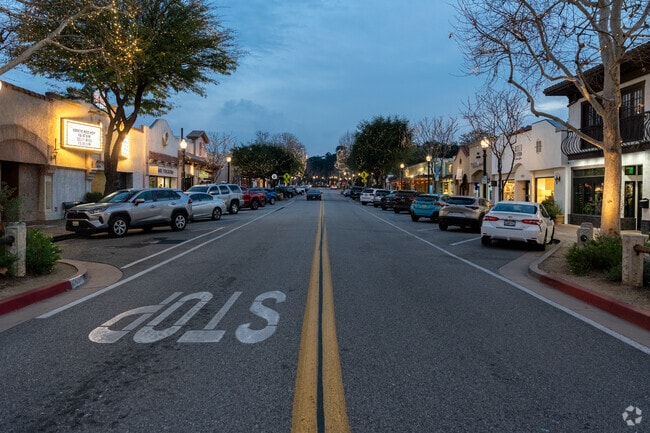
Old Town Newhall celebrates the area's Western heritage through the Walk of Western Stars and the William S. Hart Museum, located in the silent film star's historic mansion. California Institute of the Arts (CalArts) has enriched the community since 1971. Nature enthusiasts can explore Placerita Canyon State Park, home to the Oak of the Golden Dream, which marks California's first documented gold discovery site from 1842. The area's movie ranches and filming locations have earned it recognition in the entertainment industry. Santa Clarita's layout incorporates retail centers, business parks, and recreational facilities throughout its neighborhoods.
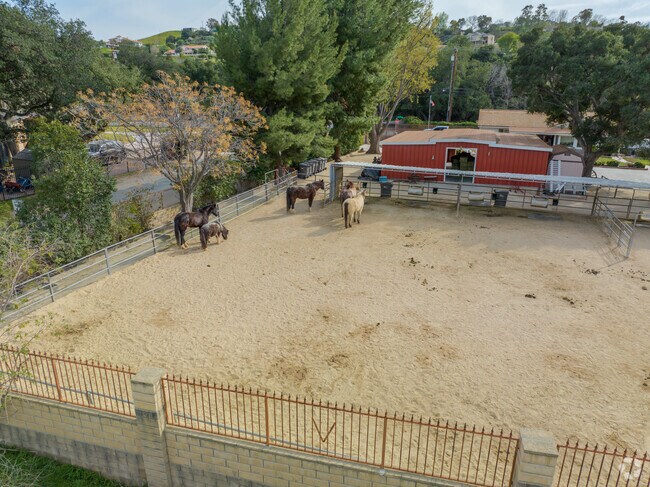
Private hillside Tudor estates are surrounded by Newhall's natural beauty.
Mediterranean-style condos in Newhall offer the benefit of ownership with less maintenance.
Green spaces are a large part of Newhall’s character.
A father and son shooting some hoops at Plum Canyon Park in Saugus.
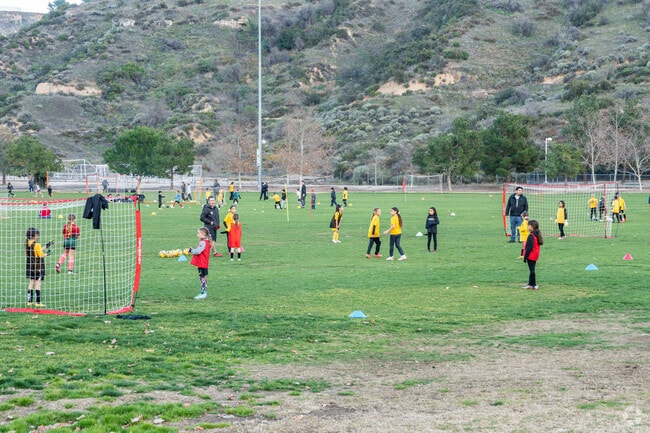
Young teams practice soccer at Central Park in Saugus.
A bicyclist comes off a trail at Bothwell Park in Golden Valley Ranch.
As of March 2026, the average apartment rent in Santa Clarita, CA is $1,882 for a studio, $2,242 for one bedroom, $2,618 for two bedrooms, and $3,331 for three bedrooms. Apartment rent in Santa Clarita has decreased by -0.3% in the past year.
Explore how walkable, bikeable, drivable, and transit-friendly Santa Clarita, CA is for everyday living.
Car-Dependent
This area is considered a car-dependent area and most errands will require a car.
Somewhat Bikeable
You might be able to find places to ride your bike in this area, but you’ll most likely want your car for most errands.
Public
Grades K-5

Public
Grades K-5
Public
Grades K-5
Public
Grades K-5

Public
Grades K-5
Public
Grades 6-8

Public
Grades 6-8

Public
Grades 6-8

Public
Grades 6-8
Public
Grades 6-8

Public
Grades 9-12
Public
Grades 9-12
Public
Grades 9-12
Public
Grades 9-12
Public
Grades 9-12

25
Communities
13,630
Units
7
Cities

3,488
Communities
959,299
Units
894
Cities

164
Communities
53,425
Units
74
Cities

184
Communities
52,881
Units
134
Cities

209
Communities
67,041
Units
114
Cities

164
Communities
42,465
Units
96
Cities
† Our analysis of utilities, groceries, transportation, healthcare, home prices, and other goods and services is sourced from the Cost of Living Index, a respected benchmark published by the Council for Community and Economic Research (C2ER) that provides a thorough overview of living expenses across different regions.
Rent data is provided by CoStar Group’s Market Trend reports. As the industry leader in commercial real estate information, analytics, and news, CoStar conducts extensive research to produce and maintain a comprehensive database of commercial real estate information. We combine this data with public record to provide the most up-to-date rental information available.
Consumer goods, services, and home prices are sourced from the Cost of Living Index published by the Council for Community and Economic Research (C2ER). The data on this page is updated quarterly. It was last published in February 2026.


