Median Age
35 Years
Largest Age Group
20-29 Years
Approximately 17% of Residents
Under 20
24%
Over 65
15%


Avg Rent
$1,477
Population
120,848
Renter Mix
51% Rent
Richardson, Texas, sits at the crossroads of Dallas and Collin counties, functioning as a well-established inner suburb that draws on proximity to both Dallas and Plano without feeling like a satellite of either. The city's identity is anchored by the University of Texas at Dallas and the renowned Telecom Corridor, a concentrated stretch hosting major names in telecommunications and technology, including AT&T, Cisco Systems, Samsung, and Texas Instruments. Blue Cross Blue Shield of Texas is also headquartered here, giving the local economy a broad, diversified foundation.
Neighborhoods like Canyon Creek and Heights Park offer a settled, tree-lined character, while the CityLine district delivers a more contemporary pace with walkable mixed-use development. The Charles W. Eisemann Center for Performing Arts brings Broadway tours and classical performances to residents throughout the year. The Cottonwood Art Festival, held each May, draws artists and attendees from across the region to one of Texas's longest-running outdoor fine arts events.
The rental landscape reflects that range of character. Apartment communities in Richardson run from traditional garden-style units to sleek high-rises near CityLine, alongside townhomes in quieter residential pockets. DART light rail connections and easy highway access to US-75 make the city a practical base for commuters throughout the greater Dallas area.
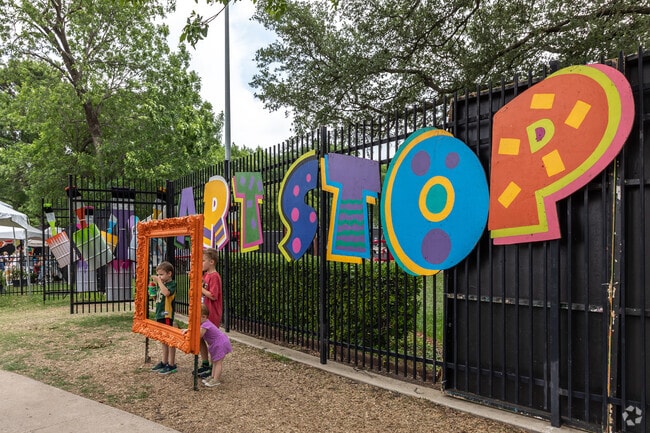
The Richardson Art Festival is filled with art loving residents.
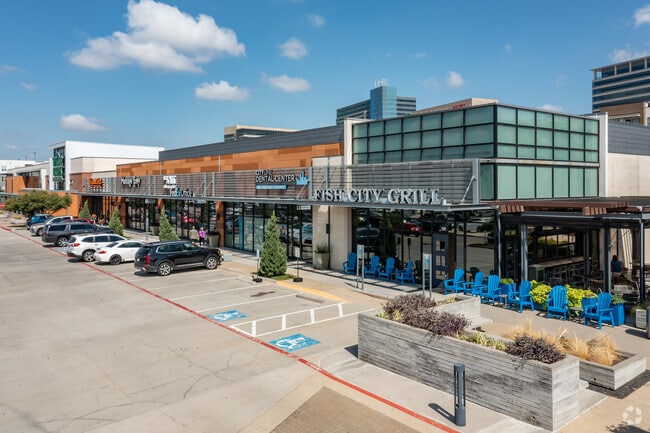
The shopping and restaurants at CityLine in Richardson are where locals go.
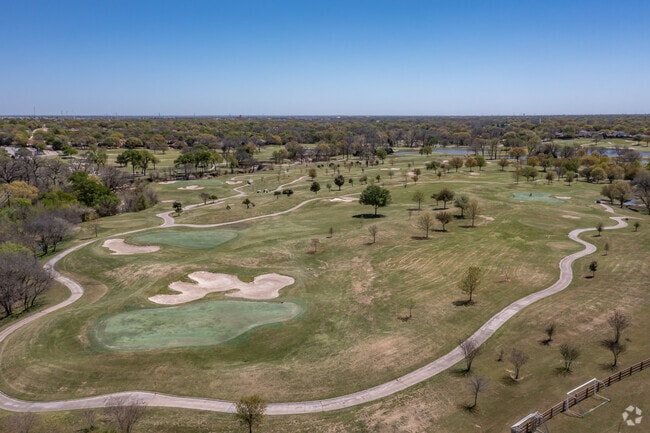
Richardson's Sherrill Park Golf Course has 2 regulation courses to choose from.
Richardson Retail Richardson Heights Fountain
The Richardson Public Library courtyard is filled with fun art and statues.
Stop to watch the turtles sunbath at Duck Creek Linear Park in Richardson.
Median Household Income
$86,146
Average: $112,275
Education
49,747
Residents Have a Degree
Job Market
64,335
Workers Employed
Median Age
35 Years
Largest Age Group
20-29 Years
Approximately 17% of Residents
Under 20
24%
Over 65
15%
Housing Distribution
In Richardson, there are roughly the same number of renters and homeowners.

Education Distribution
Review this city's overall education levels.

As of July 2026, the average apartment rent in Richardson, TX is $1,272 for a studio, $1,471 for one bedroom, $1,833 for two bedrooms, and $2,108 for three bedrooms. Apartment rent in Richardson has increased by 1.1% in the past year.
Explore how walkable, bikeable, drivable, and transit-friendly Richardson, TX is for everyday living.
Moderately Walkable
Walkability
Limited Public Transit
Transit
Moderately Drivable
Drivability
Fairly Bikeable
Bikeability
Public
Grades PK-5
667 Students

Public
Grades PK-5
490 Students
Prairie Creek Elementary School
Public
Grades PK-5
300 Students
Public
Grades K-5
546 Students

Public
Grades K-5
462 Students
Richardson West Junior High School
Public
Grades 6-8
771 Students

Richardson North Junior High School
Public
Grades 6-8
592 Students

Public
Grades 6-8
586 Students

Public
Grades 6-8

Public
Grades 9-12
2,773 Students
Public
Grades 9-12
2,443 Students
Public
Grades 9-12
2,346 Students

Evolution Academy Charter School
Public
Grades 9-12
233 Students

Winfree Academy Charter School (Ri
Public
Grades 9-12
136 Students
† Our analysis of utilities, groceries, transportation, healthcare, home prices, and other goods and services is sourced from the Cost of Living Index, a respected benchmark published by the Council for Community and Economic Research (C2ER) that provides a thorough overview of living expenses across different regions.
Rent data is provided by CoStar Group’s Market Trend reports. As the industry leader in commercial real estate information, analytics, and news, CoStar conducts extensive research to produce and maintain a comprehensive database of commercial real estate information. We combine this data with public record to provide the most up-to-date rental information available.
Consumer goods, services, and home prices are sourced from the Cost of Living Index published by the Council for Community and Economic Research (C2ER). The data on this page is updated quarterly. It was last published in June 2026.
Demographic information comes from Neustar and combines detailed address data with U.S. Census and American Community Survey statistics to produce reliable local estimates.


