Median Age
45 Years
Largest Age Group
35-44 Years
Approximately 14% of Residents
Under 20
20%
Over 65
27%
Avg Rent
$1,133
Population
10,738
Renter Mix
42% Rent
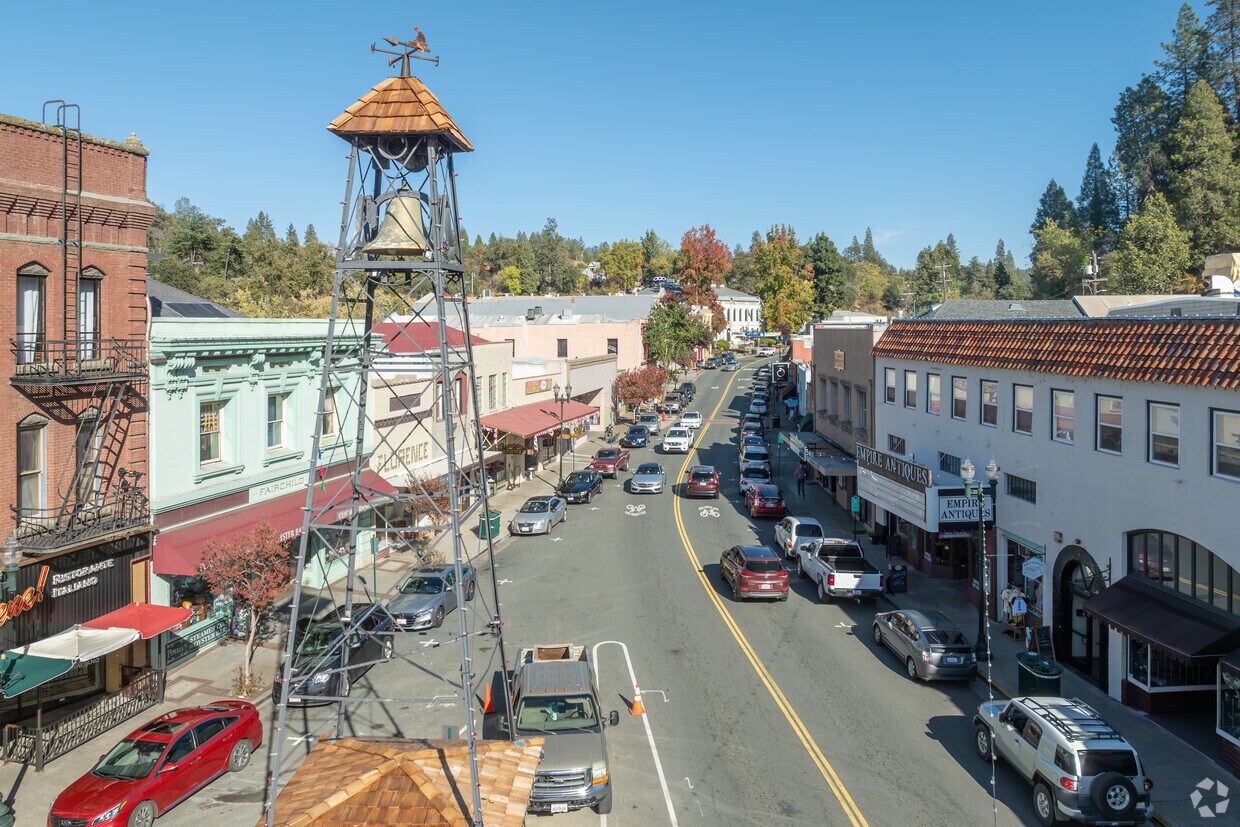
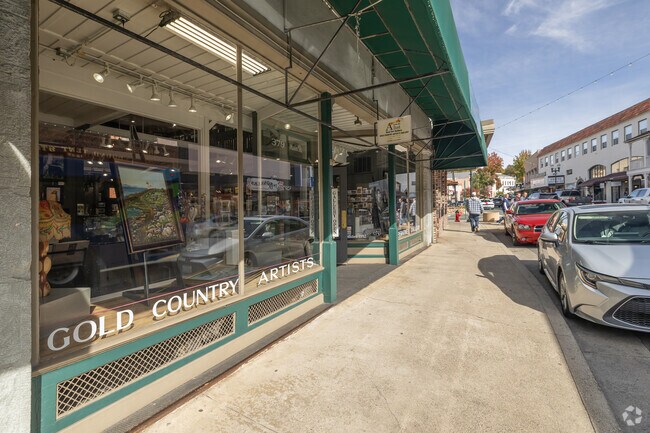
Placerville is the county seat of El Dorado County, sitting squarely along Highway 50 between Sacramento and South Lake Tahoe, which puts two very different worlds within an hour's reach. The city earned its name from the placer mining that defined its early identity, and that Gold Rush heritage still shapes the character of downtown, where historic storefronts and local shops line streets that date back to the 1850s. Folsom Lake College operates a campus nearby in El Dorado Hills, adding an educational anchor to the area. The broader economy draws from county government, healthcare, retail, and the surrounding wine country of the Sierra Foothills, one of California's most respected wine-growing regions.
Life here feels deliberately unhurried. Neighborhoods range from compact, walkable blocks near the historic core to more spread-out residential areas on the hillsides surrounding the city. The housing mix reflects that range, with traditional single-family rentals, smaller apartment communities tucked into quiet streets, and a modest but steady inventory of townhomes. Renters who want elbow room without the premium price tag of coastal California often find Placerville worth a close look. The city covers a wide swath of land, so options span from close-in spots to greener, more secluded settings just minutes from the center of town.
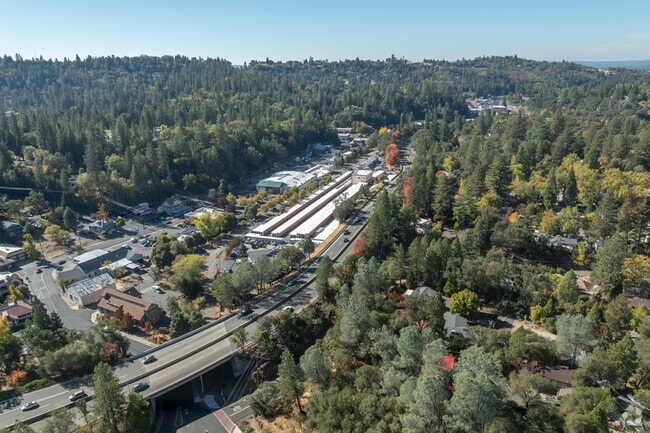
Placerville has scenic views of the Sierra Nevada foothills.
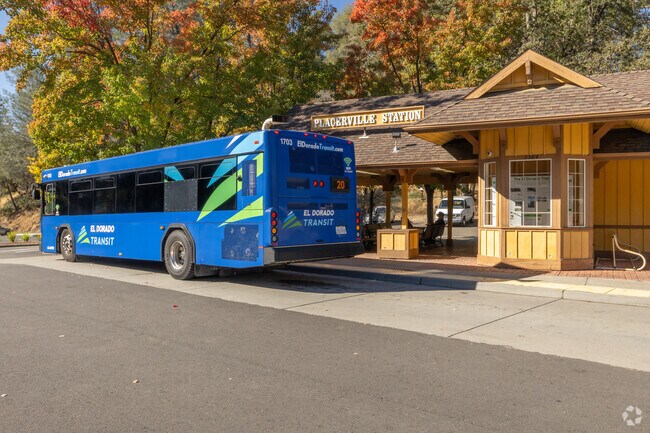
Placerville Station is where bus riders connect and start journeys to destinations near and far.
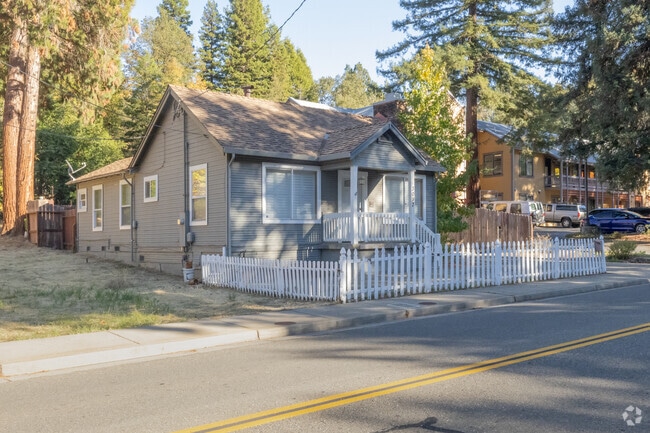
Bungalows are a common house style near the downtown area of Placerville.
Families come to Benham Park in Placerville to enjoy the open green space.
Gem panning at The Gold Bug Park Mine in Placerville is a fun family activity.
The Gold Bug Park Mine offers a look into early days of mining in Placerville.
Median Household Income
$72,995
Average: $93,261
Education
2,842
Residents Have a Degree
Job Market
5,113
Workers Employed
Median Age
45 Years
Largest Age Group
35-44 Years
Approximately 14% of Residents
Under 20
20%
Over 65
27%
Housing Distribution
Placerville has more homeowners than renters.

Education Distribution
Review this city's overall education levels.

As of August 2026, the average apartment rent in Placerville, CA is $933 for a studio, $1,133 for one bedroom, $1,505 for two bedrooms, and $1,940 for three bedrooms. Apartment rent in Placerville has increased by 1.0% in the past year.
Explore how walkable, bikeable, drivable, and transit-friendly Placerville, CA is for everyday living.
Somewhat Walkable
Walkability
Exceptionally Drivable
Drivability
Somewhat Bikeable
Bikeability
Public
Grades K-5
402 Students

Public
Grades K-12
2,511 Students

Sutter's Mill Elementary School
Public
Grades K-5
201 Students
Public
Grades K-8
274 Students

Indian Creek Elementary School
Public
Grades K-5
392 Students

Public
Grades K-12
2,511 Students
Public
Grades 6-8
431 Students
Public
Grades 6-8
431 Students
Public
Grades K-8
274 Students
Herbert C. Green Middle School
Public
Grades K-8
363 Students
Public
Grades K-12
2,511 Students
Public
Grades 9-12
1,135 Students
Public
Grades K-12
202 Students

† Our analysis of utilities, groceries, transportation, healthcare, home prices, and other goods and services is sourced from the Cost of Living Index, a respected benchmark published by the Council for Community and Economic Research (C2ER) that provides a thorough overview of living expenses across different regions.
Rent data is provided by CoStar Group’s Market Trend reports. As the industry leader in commercial real estate information, analytics, and news, CoStar conducts extensive research to produce and maintain a comprehensive database of commercial real estate information. We combine this data with public record to provide the most up-to-date rental information available.
Consumer goods, services, and home prices are sourced from the Cost of Living Index published by the Council for Community and Economic Research (C2ER). The data on this page is updated quarterly. It was last published in June 2026.
Demographic information comes from Neustar and combines detailed address data with U.S. Census and American Community Survey statistics to produce reliable local estimates.


