
The W on Broadway
219 Broadway St,
Paducah, KY 42001
$2,500 - $3,600
1-2 Beds
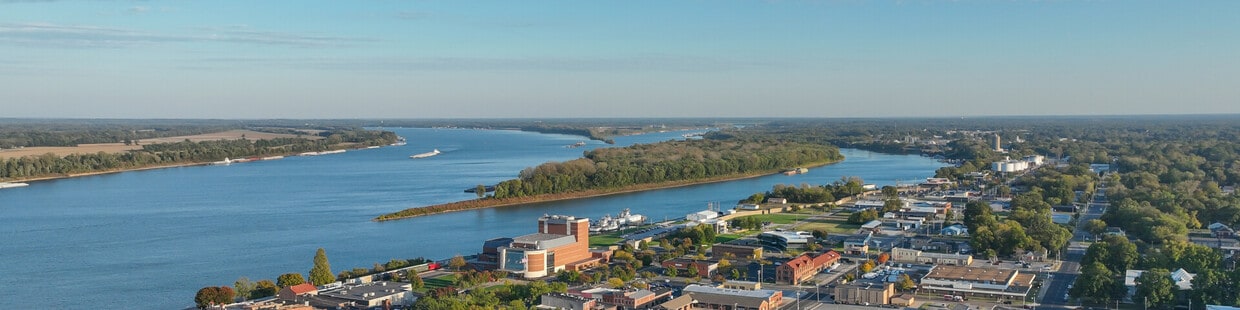


Located at the meeting point of the Tennessee and Ohio Rivers, Paducah, Kentucky celebrates its artistic heritage and riverside location. The downtown area features the National Quilt Museum and detailed floodwall murals that tell the city's story. Housing choices include properties in the Lower Town Arts District and throughout the city. Current rental rates average $896 for a one-bedroom apartment with a 3.1% annual increase, while two-bedroom units average $976 monthly.
Twenty blocks of downtown Paducah are listed on the National Register of Historic Places, preserving the area's architectural character. Outdoor spaces include the riverfront park system and nearby Land Between the Lakes recreation area. Downtown features independent shops and galleries, especially active during the annual QuiltWeek festival. Paducah holds the distinction of being designated a UNESCO Creative City of Crafts and Folk Art. The city is home to Baptist Health and Mercy Health-Lourdes hospitals, while West Kentucky Community and Technical College serves the educational needs of the community. As an inland port, Paducah's position at the intersection of major waterways supports its economy.
These Ohio River murals pay dedication to Downtown Paducah's history.
Locals can fish at Bob Noble Park near Conrad Heights.
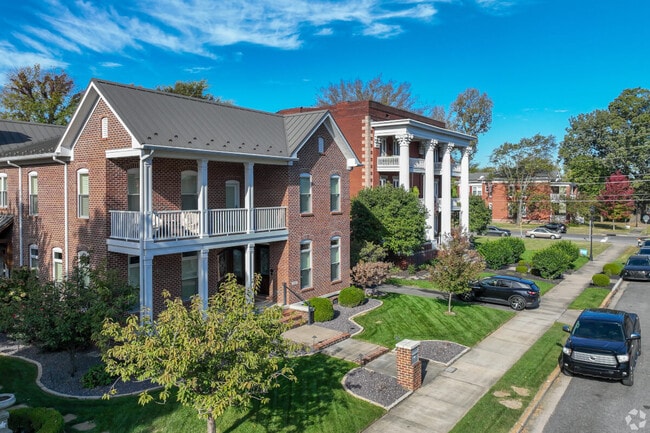
Downtown Paducah is a melting pot of different home styles like Greek Revival.
As of March 2026, the average apartment rent in Paducah, KY is $904 for one bedroom, $990 for two bedrooms, and $1,315 for three bedrooms. Apartment rent in Paducah has increased by 0.5% in the past year.
The cost of living in Paducah, KY is 9.3% lower than the national average. Generally, housing in Paducah is 19.5% less expensive than the national average, with rent falling between $0 - $1,315. You can expect to pay 6.1% less for groceries, 11.8% more for utilities, and 9.7% less for transportation.
Explore how walkable, bikeable, drivable, and transit-friendly Paducah, KY is for everyday living.
Car-Dependent
This area is considered a car-dependent area and most errands will require a car.
Somewhat Bikeable
You might be able to find places to ride your bike in this area, but you’ll most likely want your car for most errands.
Public
Grades PK-5

Hendron Lone Oak Elementary School
Public
Grades PK-5
Public
Grades K-5

Public
Grades PK-5

Public
Grades K-5
Public
Grades 6-8
Public
Grades 6-8

Public
Grades 6-8

Public
Grades K-12

Public
Grades 9-12
Public
Grades 9-12

Public
Grades 9-12
914 Students
Public
Grades 9-12
478 Students
Paducah Area Technology Center
Public
Grades 9-12
† Our analysis of utilities, groceries, transportation, healthcare, home prices, and other goods and services is sourced from the Cost of Living Index, a respected benchmark published by the Council for Community and Economic Research (C2ER) that provides a thorough overview of living expenses across different regions.
Rent data is provided by CoStar Group’s Market Trend reports. As the industry leader in commercial real estate information, analytics, and news, CoStar conducts extensive research to produce and maintain a comprehensive database of commercial real estate information. We combine this data with public record to provide the most up-to-date rental information available.
Consumer goods, services, and home prices are sourced from the Cost of Living Index published by the Council for Community and Economic Research (C2ER). The data on this page is updated quarterly. It was last published in February 2026.


