
Link OC
1075 N Link,
Anaheim, CA 92806
$2,400 - $4,046
Studio - 2 Beds
Orange combines historic architecture with contemporary living in the heart of Orange County. The city centers around Old Towne District, the largest National Register District in California, where the Orange Circle serves as a central gathering place for dining, shopping, and community events. Chapman University enhances the local atmosphere, while Santiago Creek Trail and numerous parks offer outdoor recreation opportunities. The rental market includes both historic properties and contemporary communities, with current average rents ranging from $2,352 for studios to $3,563 for three-bedroom units, showing modest year-over-year increases between 1.7% and 3.2%.
Orange stands out for its plaza-centered design and preservation of historic buildings, featuring California's second-largest concentration of preserved architecture. Neighborhoods each offer distinct characteristics - Old Towne showcases historic properties, Orange Park Acres features larger lots and trails, while El Modena provides tree-lined streets and parks. The Orange International Street Fair, a Labor Day weekend tradition, brings the community together to celebrate local culture and heritage. The city's thoughtful design around its central plaza makes it distinctive among Orange County communities.
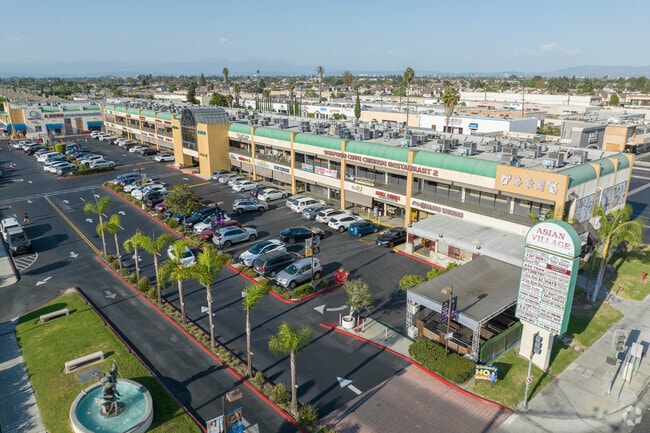
Plaza
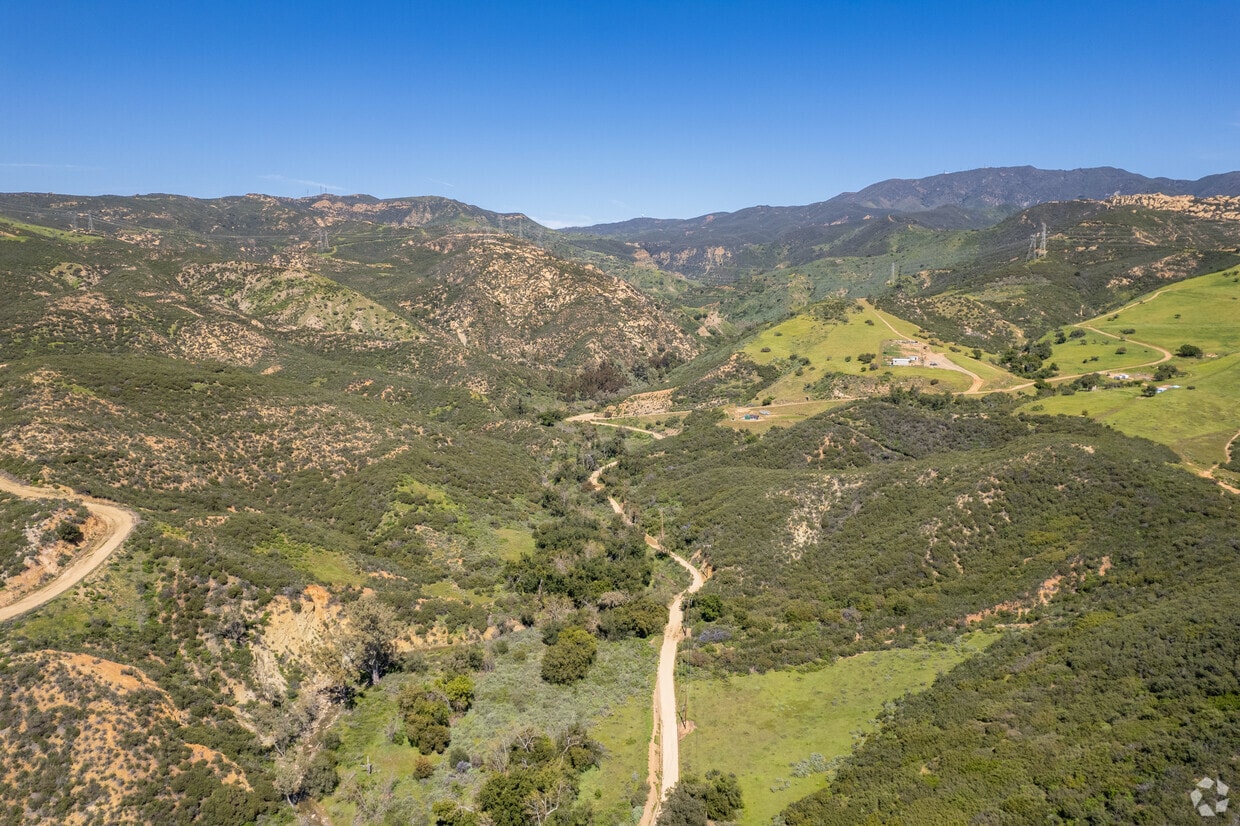
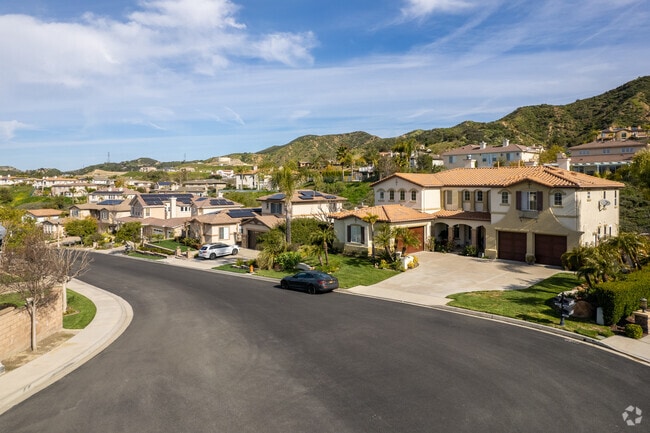
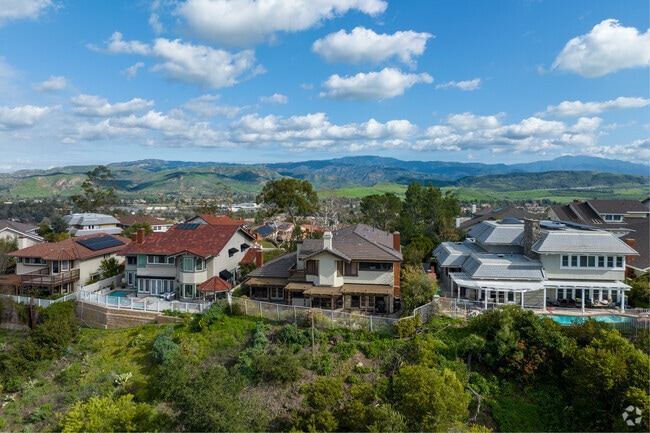
Orange homes offer hillside views and peaceful suburban living.
As of March 2026, the average apartment rent in Orange, CA is $2,320 for a studio, $2,421 for one bedroom, $2,958 for two bedrooms, and $3,701 for three bedrooms. Apartment rent in Orange has increased by 1.0% in the past year.
Explore how walkable, bikeable, drivable, and transit-friendly Orange, CA is for everyday living.
Somewhat Walkable
You might be able to get out and walk when living in this area. Some errands can be accomplished on foot, but for others you’ll need a car.
Some Transit
You'll likely want a car when living in this area since it has few transit options.
Bikeable
While there’s some bike infrastructure in this area, you’ll still need a car for many errands.
Fletcher Mandarin Language & Gate Academy
Public
Grades K-5

Public
Grades K-5

Public
Grades K-5
Public
Grades K-8
Public
Grades K-5

Public
Grades K-8
Public
Grades 6-8

Public
Grades 6-8
Public
Grades 6-8

Public
Grades 6-12

Public
Grades 9-12
Public
Grades 9-12
Public
Grades 6-12

3,490
Communities
959,772
Units
895
Cities

64
Communities
11,802
Units
29
Cities

45
Communities
10,594
Units
27
Cities

15
Communities
2,278
Units
7
Cities

625
Communities
125,220
Units
245
Cities

33
Communities
4,528
Units
22
Cities
† Our analysis of utilities, groceries, transportation, healthcare, home prices, and other goods and services is sourced from the Cost of Living Index, a respected benchmark published by the Council for Community and Economic Research (C2ER) that provides a thorough overview of living expenses across different regions.
Rent data is provided by CoStar Group’s Market Trend reports. As the industry leader in commercial real estate information, analytics, and news, CoStar conducts extensive research to produce and maintain a comprehensive database of commercial real estate information. We combine this data with public record to provide the most up-to-date rental information available.
Consumer goods, services, and home prices are sourced from the Cost of Living Index published by the Council for Community and Economic Research (C2ER). The data on this page is updated quarterly. It was last published in February 2026.


