
The Ariel - Beautifully Renovated!
851 Fields Dr,
Bowling Green, KY 42104
$1,199
2-3 Beds

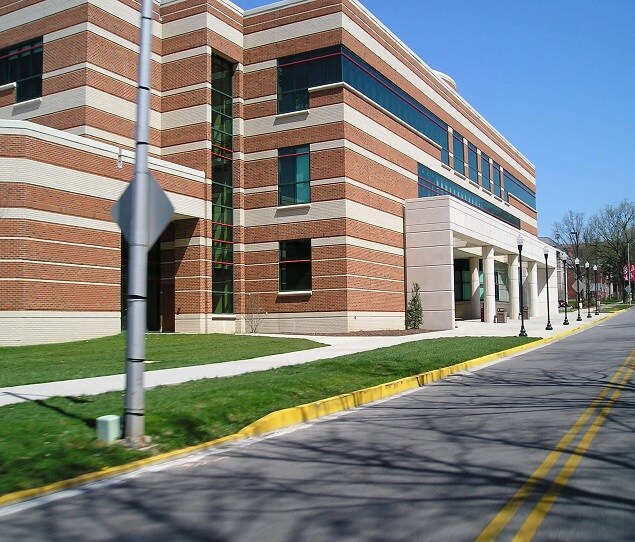
Western Kentucky University sits on a hill in beautiful Bowling Green. Founded in 1906, this public university features several top-ranking programs in engineering, business, journalism, and education. It also offers one of the nation's largest master's degree programs in folklore. The WKU Hilltoppers participate in NCAA Division I, with the football team playing at Houchens Industries-L.T. Smith Stadium. The basketball team plays at E.A. Diddle Arena and is considered one of the nation's best basketball programs. Sports fans will want to find apartments near University Drive and Old Morgantown Road to be close to the football stadium, the basketball arena, and Nick Denes Field, all of which are located between University Drive and the Avenue of Champions. To live near the variety of shops and restaurants near the university, College Street and State Street are ideal, especially closer to East Main Avenue. This is where you'll find everything from coffee houses and pubs to boutiques and jewelry stores to theaters.
As of March 2026, the average apartment rent in Bowling Green, KY is $634 for a studio, $893 for one bedroom, $1,100 for two bedrooms, and $1,512 for three bedrooms. Apartment rent in Bowling Green has decreased by -1.1% in the past year.
Studio
440 sq ft
Average Sq Ft
$634/month
Average Rent
1 BR
688 sq ft
Average Sq Ft
$893/month
Average Rent
2 BR
1,016 sq ft
Average Sq Ft
$1,100/month
Average Rent
3 BR
1,292 sq ft
Average Sq Ft
$1,512/month
Average Rent
Explore how walkable, bikeable, drivable, and transit-friendly Western Kentucky University - Bowling Green, KY (University) is for everyday living.
Car-Dependent
This area is considered a car-dependent area and most errands will require a car.
Minimal Transit
You'll likely want a car when living in this area since it has few transit options.
Somewhat Bikeable
You might be able to find places to ride your bike in this area, but you’ll most likely want your car for most errands.
Public
Grades PK-6
876 Students

Public
Grades PK-6
698 Students
Public
Grades K-5
439 Students
Public
Grades PK-6
679 Students

Public
Grades PK-6
603 Students
Public
Grades 7-8
729 Students

Public
Grades 7-8
772 Students

Public
Grades 7-8
487 Students

Public
Grades 6-8
963 Students
Public
Grades 6-12
191 Students

Public
Grades 9-12
1,494 Students
Public
Grades 9-12
1,370 Students
Public
Grades 9-12
1,294 Students
Public
Grades 9-12
1,031 Students
Public
Grades 6-12
191 Students

3,486
Communities
958,770
Units
894
Cities

715
Communities
198,674
Units
340
Cities

624
Communities
174,107
Units
247
Cities

624
Communities
125,068
Units
245
Cities

553
Communities
123,847
Units
220
Cities

458
Communities
108,467
Units
229
Cities
† Our analysis of utilities, groceries, transportation, healthcare, home prices, and other goods and services is sourced from the Cost of Living Index, a respected benchmark published by the Council for Community and Economic Research (C2ER) that provides a thorough overview of living expenses across different regions.
Rent data is provided by CoStar Group’s Market Trend reports. As the industry leader in commercial real estate information, analytics, and news, CoStar conducts extensive research to produce and maintain a comprehensive database of commercial real estate information. We combine this data with public record to provide the most up-to-date rental information available.
Consumer goods, services, and home prices are sourced from the Cost of Living Index published by the Council for Community and Economic Research (C2ER). The data on this page is updated quarterly. It was last published in February 2026.


