
Enclave at Winghaven
1000 Applerock Dr,
O'Fallon, MO 63368
$1,125 - $2,269
1-3 Beds
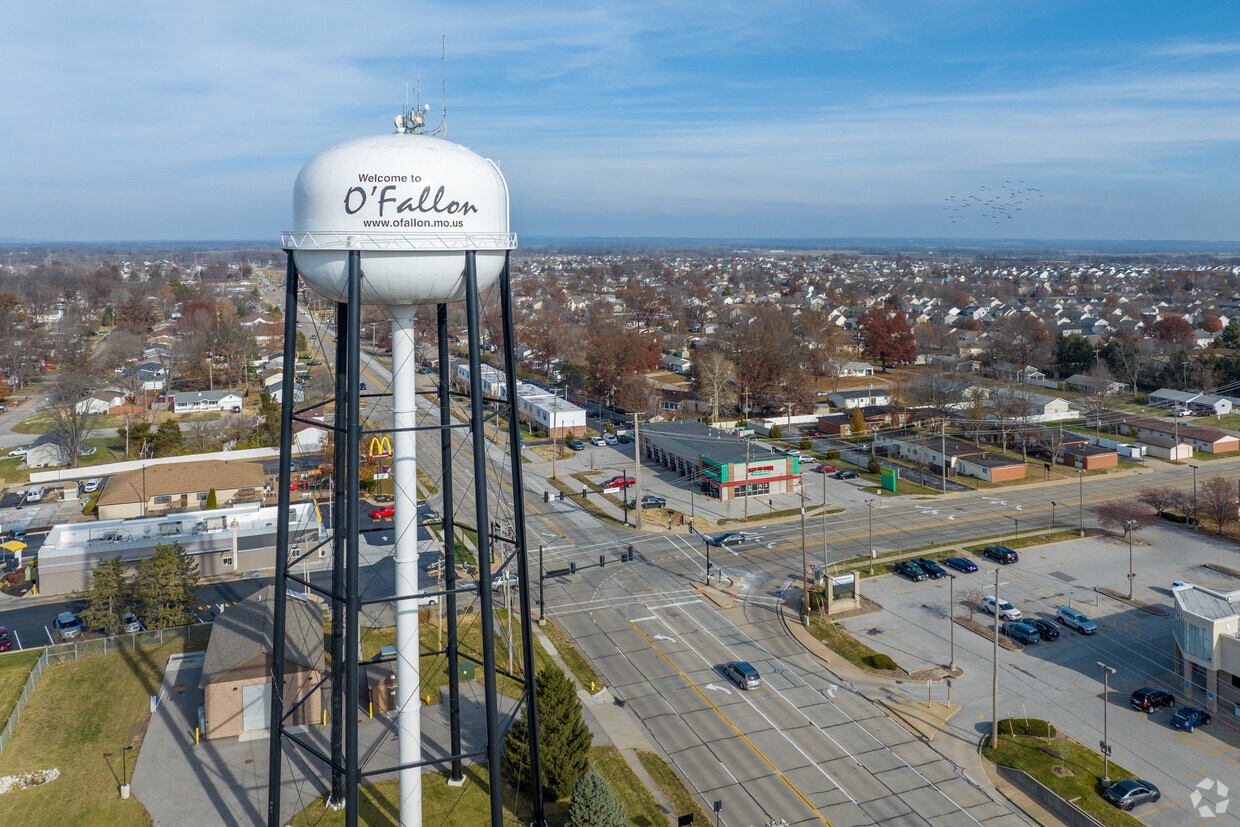


Mix a fantastic location with a beautiful community near the Mississippi River, sprinkle in terrific parks and historic sites, and add a dash of excellent location and strong economy, and the result is definitely a treat! So much so that O'Fallon consistently ranks on Money Magazine's "Best 100 Places to Live" list. As one of the largest cities in the St. Louis metro area, O'Fallon is directly north of the river, bordering the Weldon Spring Conservation Area. Nearby destinations are plentiful -- Mid Rivers Mall, Lake Saint Louis, St. Louis Premium Outlets, Chesterfield Mall, Maryville University, Hollywood Casino & Hotel St. Louis, the St. Charles Convention Center are all minutes away from O'Fallon. And while there are plenty of employers near O'Fallon (including the GM Wentzville Assembly Center), commutes into Downtown St. Louis only take about 30 minutes.
Dardenne Creek runs through BaratHaven Park.
Find peace through the windy trails of BaratHaven Park.
Peruque Creek runs through Dames Park and the surrounding area.
Dames Park walking trails weave throughout the entire property and provide a scenic view.
Baxter Gardens West has a location in St. Paul for all your nursery needs.
Resident in the O'Fallon St Charles neighborhood takes in the surrounding nature at Civic Park.
As of March 2026, the average apartment rent in O'Fallon, MO is $766 for a studio, $1,314 for one bedroom, $1,576 for two bedrooms, and $2,180 for three bedrooms. Apartment rent in O'Fallon has decreased by -2.1% in the past year.
Explore how walkable, bikeable, drivable, and transit-friendly O'Fallon, MO is for everyday living.
Car-Dependent
This area is considered a car-dependent area and most errands will require a car.
Somewhat Bikeable
You might be able to find places to ride your bike in this area, but you’ll most likely want your car for most errands.
Public
Grades K-5
337 Students

Public
Grades K-5
537 Students

Public
Grades K-5
436 Students
Public
Grades K-5
404 Students
Public
Grades K-5
349 Students
Public
Grades 6-8
1,255 Students

Public
Grades 6-8
1,190 Students
Public
Grades 6-8
1,067 Students
Public
Grades 9-12
1,778 Students
Public
Grades 9-12
1,497 Students

51
Communities
9,699
Units
22
Cities

557
Communities
125,188
Units
221
Cities

54
Communities
13,003
Units
46
Cities

42
Communities
10,891
Units
31
Cities

34
Communities
9,777
Units
12
Cities

315
Communities
76,967
Units
144
Cities
† Our analysis of utilities, groceries, transportation, healthcare, home prices, and other goods and services is sourced from the Cost of Living Index, a respected benchmark published by the Council for Community and Economic Research (C2ER) that provides a thorough overview of living expenses across different regions.
Rent data is provided by CoStar Group’s Market Trend reports. As the industry leader in commercial real estate information, analytics, and news, CoStar conducts extensive research to produce and maintain a comprehensive database of commercial real estate information. We combine this data with public record to provide the most up-to-date rental information available.
Consumer goods, services, and home prices are sourced from the Cost of Living Index published by the Council for Community and Economic Research (C2ER). The data on this page is updated quarterly. It was last published in February 2026.


