
Gateway Pointe Senior Apartments 55+
4 Gateway,
Euclid, OH 44119
$950 - $1,200
1-2 Beds

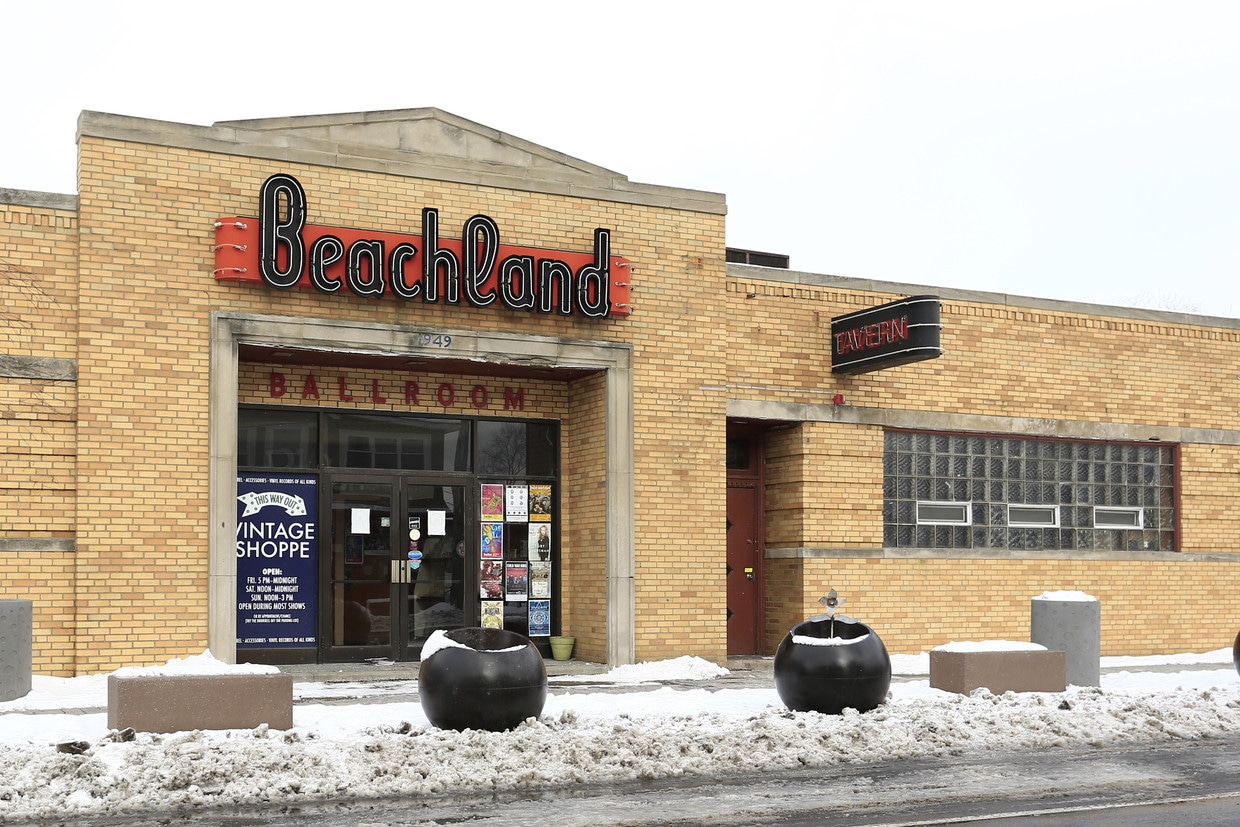
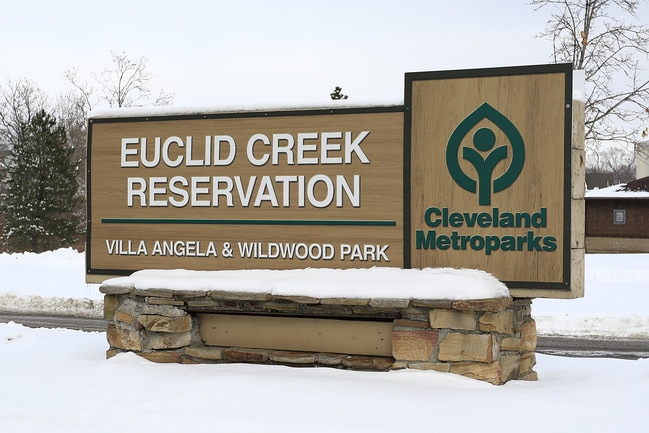
Nestled along the shores of Lake Erie, North Collinwood is a charming waterfront neighborhood just nine miles northeast of Downtown Cleveland. The neighborhood has several greenspaces and lakefront parks like Euclid Beach Park, home of the Cleveland sign and a popular spot for fishing and concerts. Along with being home to one of the city’s landmarks, North Collinwood is known for its small commercial district along Waterloo Road, which is home to the Waterloo Arts and Entertainment District. Along with housing several theaters, art galleries, and venues, Waterloo Road is packed with locally owned restaurants and shops. Similar to many Cleveland neighborhoods, renters are attracted to North Collinwood for its affordability. There are rentals available for every budget and style including cottages, bungalows, and apartments.
As of March 2026, the average apartment rent in North Collinwood is $437 for a studio, $706 for one bedroom, $901 for two bedrooms, and $986 for three bedrooms. Apartment rent in North Collinwood has increased by 0.8% in the past year.
Studio
469 sq ft
Average Sq Ft
$437/month
Average Rent
1 BR
572 sq ft
Average Sq Ft
$706/month
Average Rent
2 BR
808 sq ft
Average Sq Ft
$901/month
Average Rent
3 BR
1,200 sq ft
Average Sq Ft
$986/month
Average Rent
Somewhat Walkable
out of 100 WalkScore® Rating
You might be able to get out and walk when living in this area. Some errands can be accomplished on foot, but for others you’ll need a car.
Some Transit
out of 100 TransitScore® Rating
You'll likely want a car when living in this area since it has few transit options.
Somewhat Bikeable
out of 100 BikeScore® Rating
You might be able to find places to ride your bike in this area, but you’ll most likely want your car for most errands.
Current Resident
8 years and 5 months ago•Niche Review
Living in collinwood has been ok. Alot of history in the area. Plenty of different foods around from Italian to jamaican. The crime is not that bad be could be better. The roads and pot holes need fixed also.

3,474
Communities
956,534
Units
896
Cities

715
Communities
198,736
Units
340
Cities

623
Communities
124,974
Units
245
Cities

622
Communities
173,392
Units
246
Cities

548
Communities
122,772
Units
218
Cities

459
Communities
108,509
Units
230
Cities
† Our analysis of utilities, groceries, transportation, healthcare, home prices, and other goods and services is sourced from the Cost of Living Index, a respected benchmark published by the Council for Community and Economic Research (C2ER) that provides a thorough overview of living expenses across different regions.
Rent data is provided by CoStar Group’s Market Trend reports. As the industry leader in commercial real estate information, analytics, and news, CoStar conducts extensive research to produce and maintain a comprehensive database of commercial real estate information. We combine this data with public record to provide the most up-to-date rental information available.
Consumer goods, services, and home prices are sourced from the Cost of Living Index published by the Council for Community and Economic Research (C2ER). The data on this page is updated quarterly. It was last published in February 2026.


