Median Age
28 Years
Largest Age Group
20-29 Years
Approximately 25% of Residents
Under 20
29%
Over 65
8%
Avg Rent
$2,296
Population
53,845
Renter Mix
83% Rent
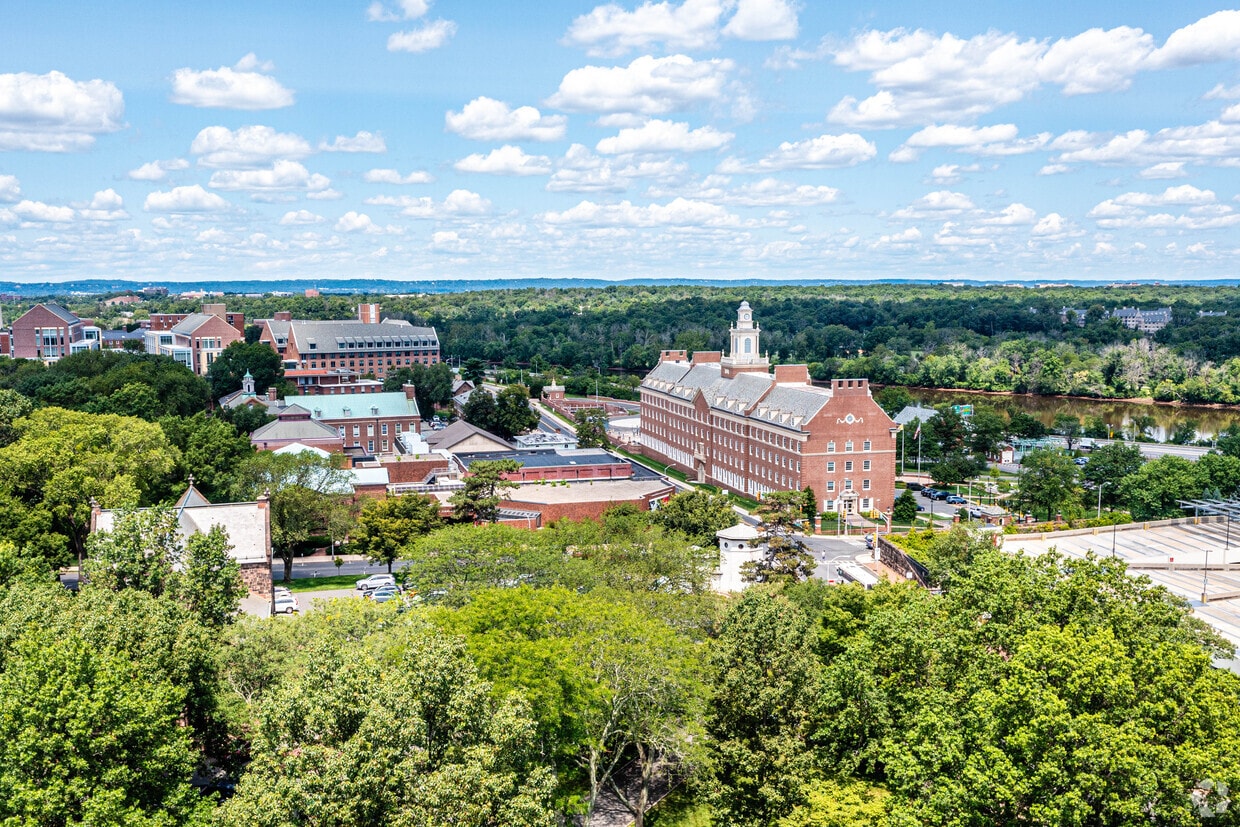
Welcome to New Brunswick, nestled along the banks of the Raritan River. This historic city combines its rich past with contemporary appeal, offering renters average monthly rates from $1,651 for studios to $3,130 for four-bedroom units, reflecting a 4.3% annual increase. Housing options include apartment communities near the train station and residential properties throughout established neighborhoods like Fifth Ward and Lincoln Park. As home to Rutgers University, downtown New Brunswick features the New Brunswick Performing Arts Center, theaters, and an array of dining destinations.
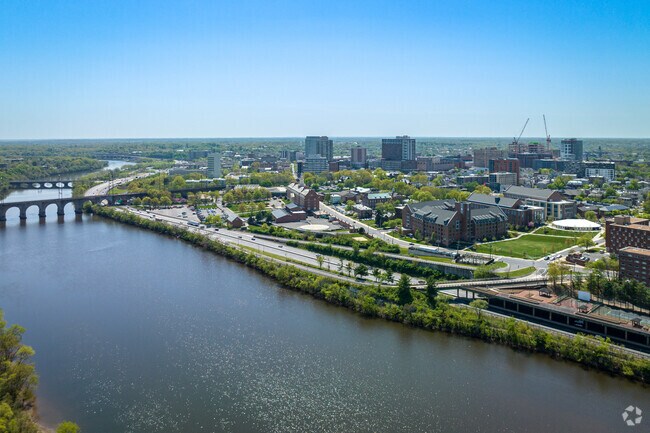
Boyd Park's 20 acres of riverfront space and the Delaware and Raritan Canal trail system provide outdoor recreation opportunities. The city serves as a significant medical center, with Robert Wood Johnson University Hospital and Saint Peter's University Hospital. Located 27 miles from Manhattan with direct service on NJ Transit's Northeast Corridor line, New Brunswick offers convenient commuting options. The city's character shines through in areas like the Livingston Avenue district and Albany Street corridor. Cultural attractions include the Zimmerli Art Museum and George Street Playhouse. A notable piece of history: New Brunswick pioneered railroad transportation of circus equipment in 1872, when William Cameron Coup developed a system for what would become the Ringling Bros. and Barnum & Bailey Circus.
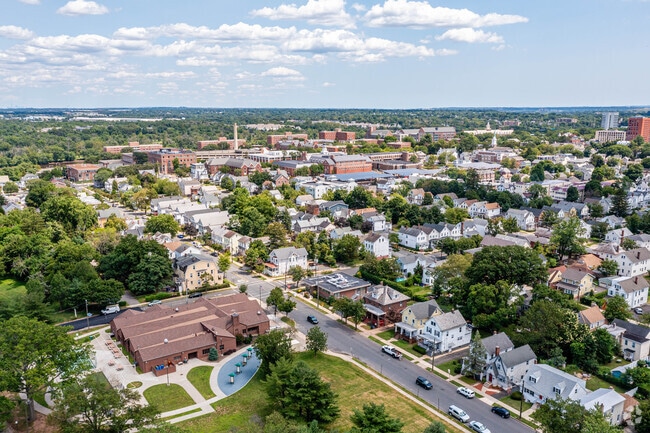
The residential part of New Brunswick, NJ. is likened to suburb living.
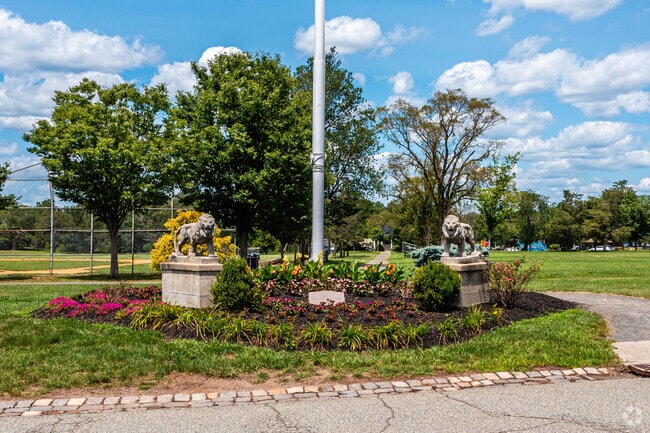
The double lions greet visitors at the entrance of Buccleuch Park in New Brunswick, NJ.
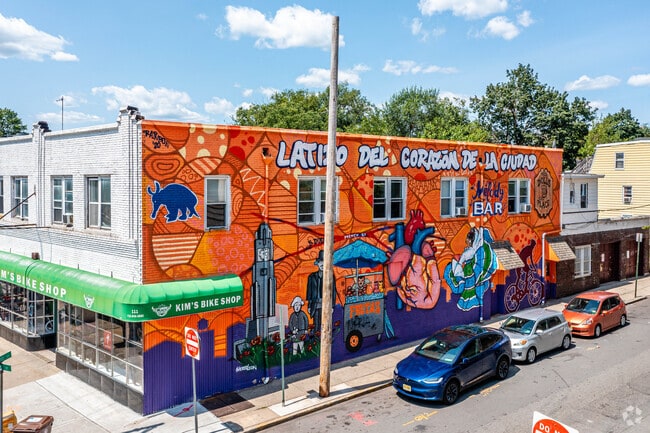
Graffiti laden buildings can be found throughout New Brunswick, NJ.
Rutgers Garden offers a great public botanical garden for observation and a nice nature escape.
Located in the heart of Downtown New Brunswick, NJ, Catherine Lombardi is an upscale Italian restaurant with homey fare and a lively bar
The Raritan River intersects Boyd Park in New Brunswick, NJ.
Median Household Income
$46,676
Average: $73,809
Education
11,429
Residents Have a Degree
Job Market
22,639
Workers Employed
Median Age
28 Years
Largest Age Group
20-29 Years
Approximately 25% of Residents
Under 20
29%
Over 65
8%
Housing Distribution
New Brunswick has more renters than homeowners.

Education Distribution
Review this city's overall education levels.

As of July 2026, the average apartment rent in New Brunswick, NJ is $1,714 for a studio, $2,295 for one bedroom, $2,940 for two bedrooms, and $3,984 for three bedrooms. Apartment rent in New Brunswick has increased by 1.8% in the past year.
The cost of living in New Brunswick, NJ is 18.1% higher than the national average. Generally, housing in New Brunswick is 46.8% more expensive than the national average, with rent falling between $1,714 - $3,984. You can expect to pay 3.2% more for groceries, 4.8% more for utilities, and 4.0% more for transportation.
Compare Cities
Explore how walkable, bikeable, drivable, and transit-friendly New Brunswick, NJ is for everyday living.
Moderately Walkable
Walkability
Strong Public Transit
Transit
Exceptionally Drivable
Drivability
Moderately Bikeable
Bikeability
A. Chester Redshaw Elementary School
Public
Grades PK-5
784 Students

Blanquita B. Valenti Community School
Public
Grades K-8
569 Students
McKinley Community Elementary School
Public
Grades PK-8
524 Students
Woodrow Wilson Elementary School
Public
Grades PK-8
373 Students
Paul Robeson Community Elementary School
Public
Grades PK-8
665 Students

Blanquita B. Valenti Community School
Public
Grades K-8
569 Students
McKinley Community Elementary School
Public
Grades PK-8
524 Students
Woodrow Wilson Elementary School
Public
Grades PK-8
373 Students
Public
Grades 6-8
1,259 Students
Paul Robeson Community Elementary School
Public
Grades PK-8
665 Students
Public
Grades 9-12
2,477 Students

Public
Grades 6-12

† Our analysis of utilities, groceries, transportation, healthcare, home prices, and other goods and services is sourced from the Cost of Living Index, a respected benchmark published by the Council for Community and Economic Research (C2ER) that provides a thorough overview of living expenses across different regions.
Rent data is provided by CoStar Group’s Market Trend reports. As the industry leader in commercial real estate information, analytics, and news, CoStar conducts extensive research to produce and maintain a comprehensive database of commercial real estate information. We combine this data with public record to provide the most up-to-date rental information available.
Consumer goods, services, and home prices are sourced from the Cost of Living Index published by the Council for Community and Economic Research (C2ER). The data on this page is updated quarterly. It was last published in June 2026.
Demographic information comes from Neustar and combines detailed address data with U.S. Census and American Community Survey statistics to produce reliable local estimates.


