Median Age
40 Years
Largest Age Group
10-19 Years
Approximately 13% of Residents
Under 20
25%
Over 65
19%

Area Guide
Avg Rent
$542
Population
13,943
Renter Mix
46% Rent
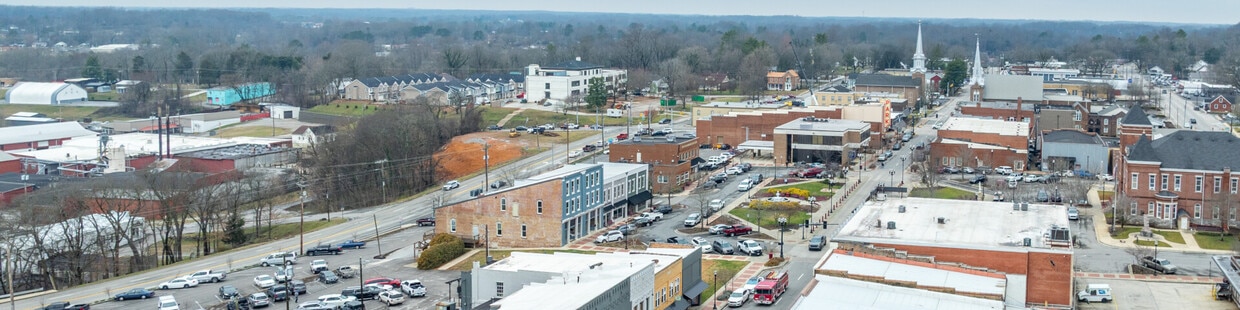
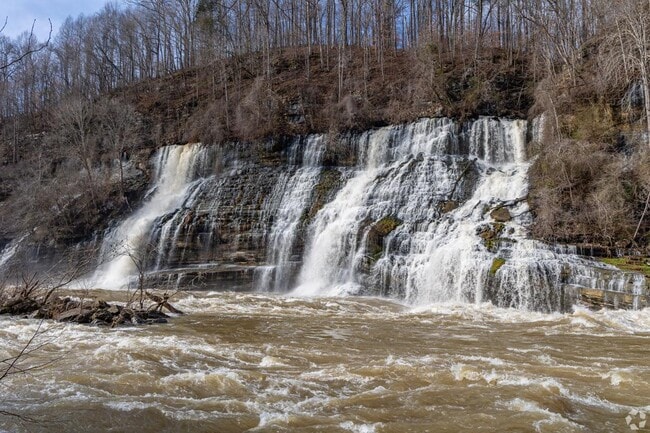
Nestled in the foothills of the Cumberland Plateau, McMinnville is situated about halfway between Nashville and Chattanooga in Warren County. The lush surrounding environment of the Upper Cumberland provides abundant options for outdoor recreation at local parks as well as attractions like the Cumberland Caverns, Rock Island State Park, and Fall Creek Falls State Park.
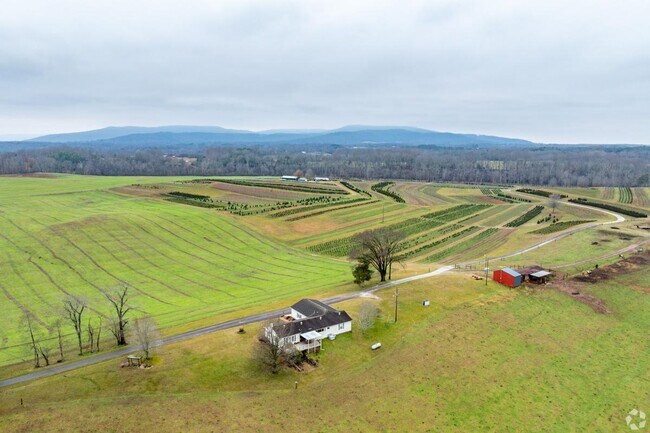
Nicknamed the Nursery Capital of the World, McMinnville is a landscaping hobbyist’s dream, containing hundreds of wholesale and retail nurseries. McMinnville also draws music lovers from all over the world to enjoy live performances at the one-of-a-kind Bluegrass Underground.
McMinnville maintains a small-town atmosphere with friendly residents and a strong sense of community. Annual events such as the Mountain Crawl, Taste of the Underground, Warren County Arts and Crafts Fair, Autumn Street Fair, and the Christmas Parade bring the community together in McMinnville. Quick access to major highways makes getting around from McMinnville simple.
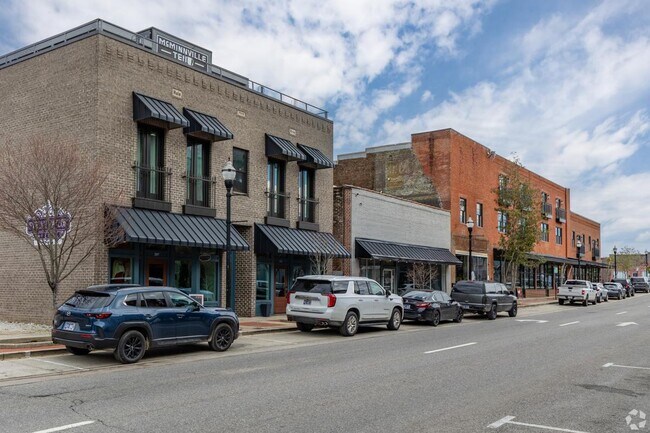
Main Street in McMinnville is home to a variety of boutiques and restaurants.
Over 400 nurseries can be found in McMinnville.
McMinnville is near outdoor opportunities, like Rock Island State Park.
Median Household Income
$38,621
Average: $52,805
Education
1,994
Residents Have a Degree
Job Market
5,673
Workers Employed
Median Age
40 Years
Largest Age Group
10-19 Years
Approximately 13% of Residents
Under 20
25%
Over 65
19%
Housing Distribution
McMinnville has more homeowners than renters.

Education Distribution
Review this city's overall education levels.

As of June 2026, the average apartment rent in McMinnville, TN is $365 for a studio, $542 for one bedroom, $736 for two bedrooms, and $850 for three bedrooms. Apartment rent in McMinnville has increased by 0.5% in the past year.
The cost of living in McMinnville, TN is 12.7% lower than the national average. Generally, housing in McMinnville is 25.0% less expensive than the national average, with rent falling between $365 - $850. You can expect to pay 4.2% less for groceries, 16.5% less for utilities, and 11.9% less for transportation.
Compare Cities
Explore how walkable, bikeable, drivable, and transit-friendly McMinnville, TN is for everyday living.
Somewhat Walkable
Walkability
Exceptionally Drivable
Drivability
Somewhat Bikeable
Bikeability
Public
Grades PK-8
542 Students

Public
Grades PK-5
662 Students

Public
Grades PK-5
514 Students

Public
Grades PK-5
482 Students
Public
Grades PK-5
482 Students
Public
Grades PK-8
542 Students
Public
Grades 6-8
784 Students
Public
Grades PK-8
390 Students
Public
Grades 9-12
1,862 Students
† Our analysis of utilities, groceries, transportation, healthcare, home prices, and other goods and services is sourced from the Cost of Living Index, a respected benchmark published by the Council for Community and Economic Research (C2ER) that provides a thorough overview of living expenses across different regions.
Rent data is provided by CoStar Group’s Market Trend reports. As the industry leader in commercial real estate information, analytics, and news, CoStar conducts extensive research to produce and maintain a comprehensive database of commercial real estate information. We combine this data with public record to provide the most up-to-date rental information available.
Consumer goods, services, and home prices are sourced from the Cost of Living Index published by the Council for Community and Economic Research (C2ER). The data on this page is updated quarterly. It was last published in June 2026.
Demographic information comes from Neustar and combines detailed address data with U.S. Census and American Community Survey statistics to produce reliable local estimates.


