Median Age
41 Years
Largest Age Group
30-39 Years
Approximately 13% of Residents
Under 20
23%
Over 65
21%

Avg Rent
$882
Population
34,947
Renter Mix
39% Rent
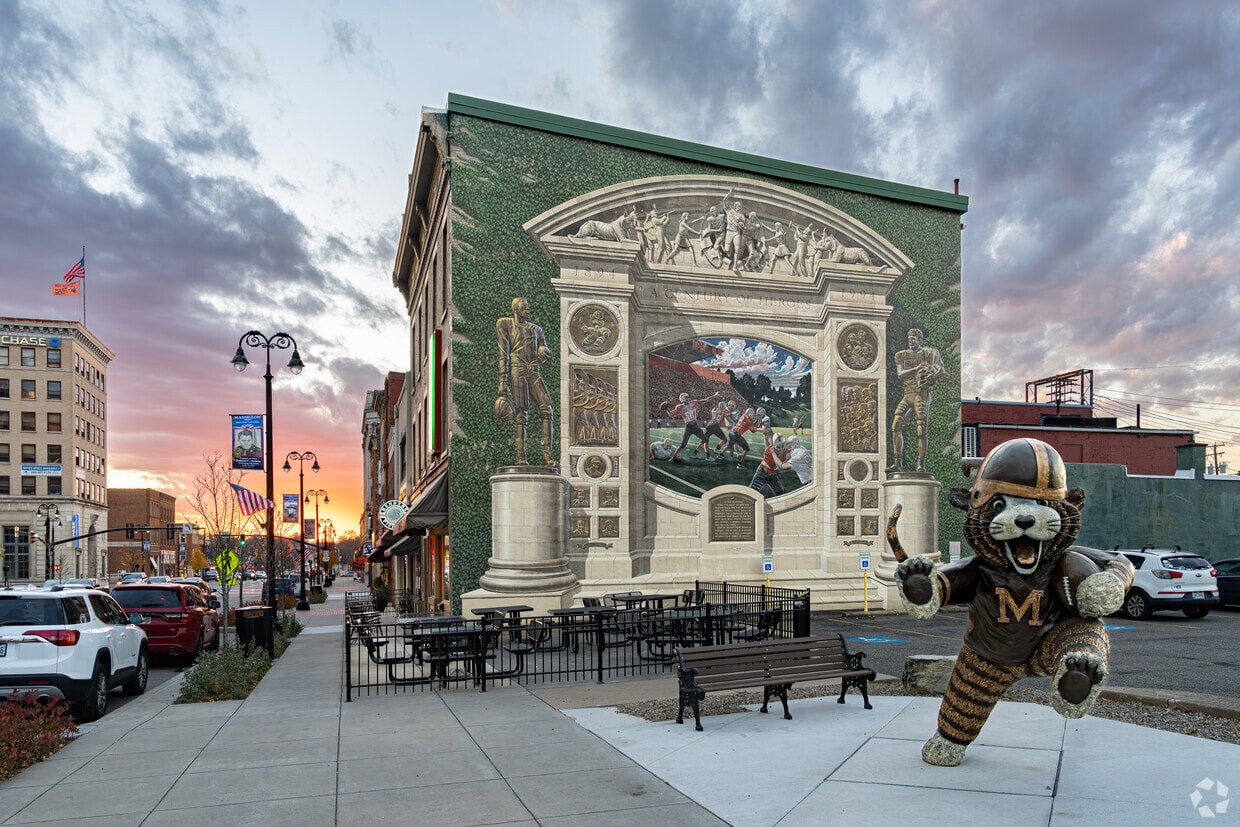
Massillon sits along the Tuscarawas River in western Stark County, about eight miles west of Canton and roughly 30 miles south of Akron, occupying a steady, grounded place in northeast Ohio's landscape. The city carries a strong sense of identity rooted in its industrial past and a high school football tradition that draws intense community pride each season at Paul Brown Tiger Stadium, named after the legendary coach who got his start here. Lincoln Way serves as the central commercial corridor, anchoring everyday life with local businesses, shops, and services within a walkable stretch of the historic downtown.
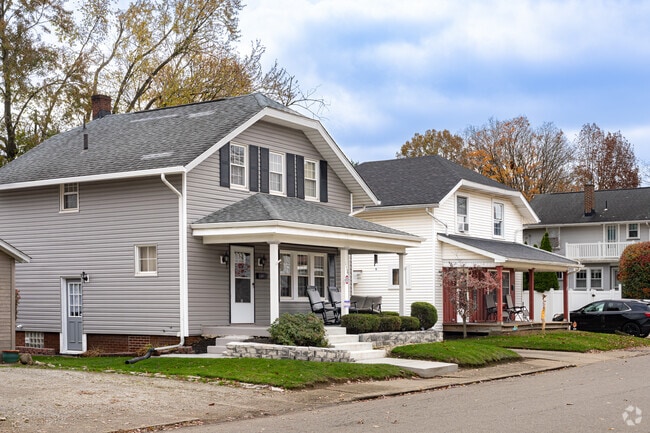
The surrounding area spans around 21 square miles, offering a range of neighborhoods from tree-lined residential streets near the river to quieter pockets on the city's edges. The Massillon Museum, free to the public, reflects the city's commitment to arts and local history. Rental options include traditional single-family homes converted into units, garden-style apartment communities, and modest multi-unit buildings. The housing stock tends toward the accessible and practical, making Massillon a reasonable base for those working in Stark County or commuting into the broader Canton-Massillon metro area.
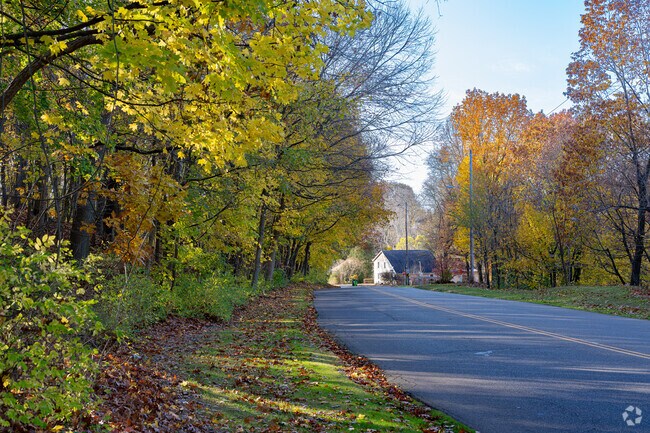
Brightly colored leaves signal that fall is coming to Downtown Massillon.
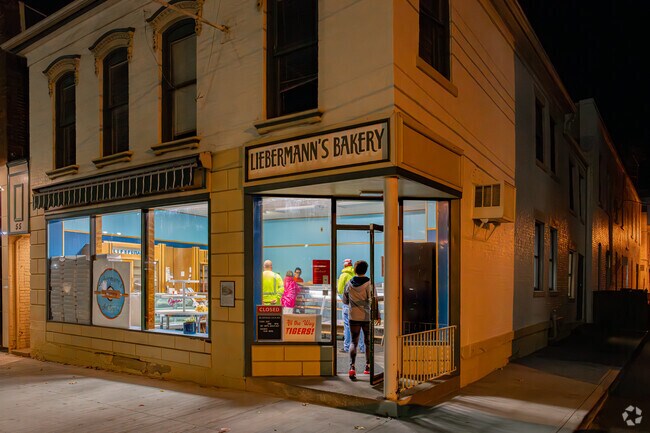
Residents of Downtown Massillon get up early to grab one of Liebermann's delicious pastries.
Cast your line at Meyers Lake in Starks Park.
The trails at Reservoir Park are scenic and full of nature.
Bison Street Burgers and Brews has great food and spirits in East Brookfield.
Massillon Fun Fest is a popular event in the Massillon neighborhood.
Median Household Income
$49,333
Average: $63,633
Education
5,797
Residents Have a Degree
Job Market
16,962
Workers Employed
Median Age
41 Years
Largest Age Group
30-39 Years
Approximately 13% of Residents
Under 20
23%
Over 65
21%
Housing Distribution
Massillon has more homeowners than renters.

Education Distribution
Review this city's overall education levels.

As of August 2026, the average apartment rent in Massillon, OH is $826 for a studio, $882 for one bedroom, $913 for two bedrooms, and $1,204 for three bedrooms. Apartment rent in Massillon has increased by 7.2% in the past year.
Explore how walkable, bikeable, drivable, and transit-friendly Massillon, OH is for everyday living.
Somewhat Walkable
Walkability
Exceptionally Drivable
Drivability
Not Bikeable
Bikeability
Public
Grades K-5
727 Students

Public
Grades K-5
812 Students

Public
Grades K-5
581 Students
Public
Grades K-5
470 Students
Public
Grades K-5
361 Students
Public
Grades 6-8
581 Students
Public
Grades K-8
1,317 Students

Public
Grades K-8
424 Students
Public
Grades 6-8
599 Students

Public
Grades 6-12
145 Students

Public
Grades 9-12
1,819 Students
Public
Grades 9-12
344 Students
Public
Grades 9-12
1,330 Students

Public
Grades 9-12
1,204 Students
Public
Grades 6-12
145 Students
† Our analysis of utilities, groceries, transportation, healthcare, home prices, and other goods and services is sourced from the Cost of Living Index, a respected benchmark published by the Council for Community and Economic Research (C2ER) that provides a thorough overview of living expenses across different regions.
Rent data is provided by CoStar Group’s Market Trend reports. As the industry leader in commercial real estate information, analytics, and news, CoStar conducts extensive research to produce and maintain a comprehensive database of commercial real estate information. We combine this data with public record to provide the most up-to-date rental information available.
Consumer goods, services, and home prices are sourced from the Cost of Living Index published by the Council for Community and Economic Research (C2ER). The data on this page is updated quarterly. It was last published in June 2026.
Demographic information comes from Neustar and combines detailed address data with U.S. Census and American Community Survey statistics to produce reliable local estimates.


