Median Age
38 Years
Largest Age Group
15-24 Years
Approximately 17% of Residents
Under 20
25%
Over 65
16%


Avg Rent
$2,658
Population
16,349
Renter Mix
35% Rent
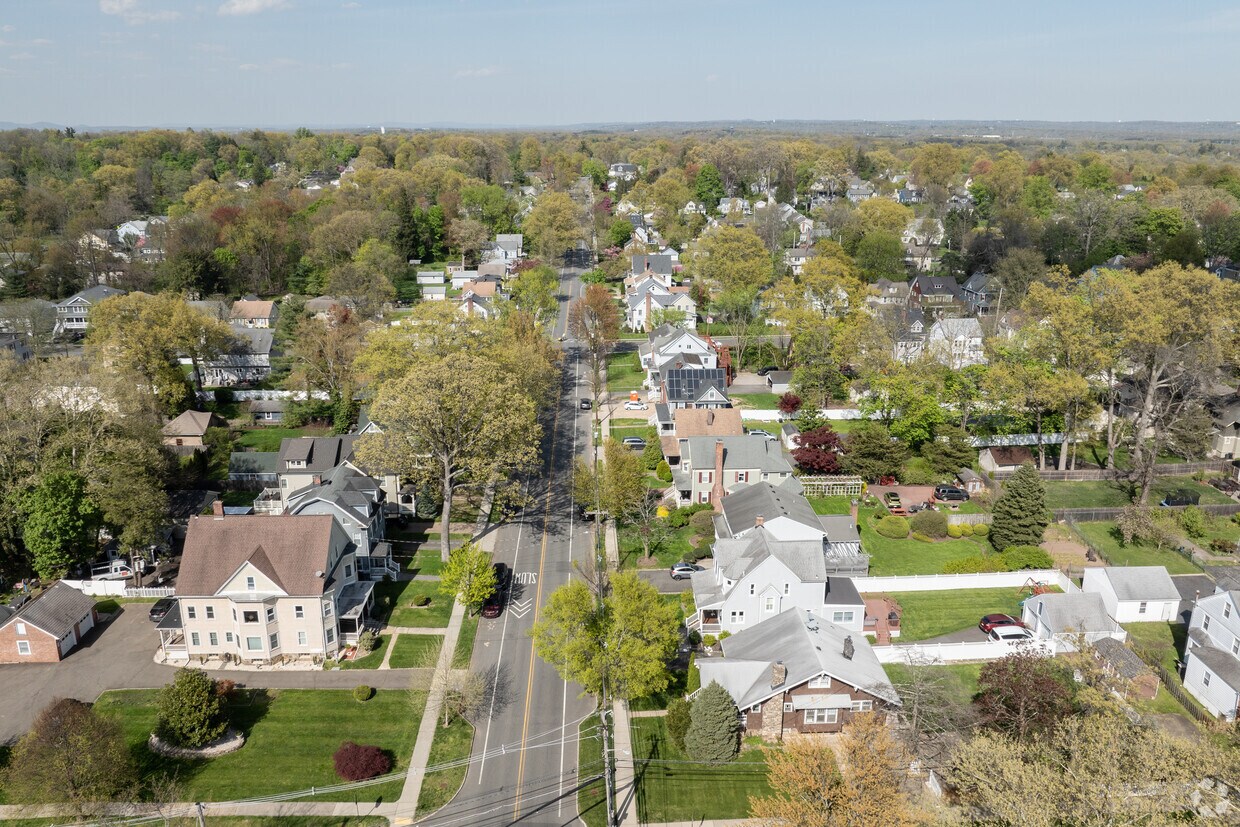
The borough of Madison is a suburban community positioned about thirty miles west of Manhattan, roughly an hour away by train. The picturesque hamlet has long been a coveted location for New York City-area commuters, with families in particular drawn by its picturesque neighborhoods, exceptional public schools, and one of the lowest crime rates in the nation.
The charming Downtown district serves as the cultural epicenter of the community, with a thriving palette of dining and nightlife options as well as hosting annual events like the wildly popular Bottle Hill day celebration every autumn. Farleigh Dixon University serves around 12,000 students from its campus on the north side of the borough, and the smaller Drew University operates adjacent to Downtown, injecting a youthful collegiate energy into the community.
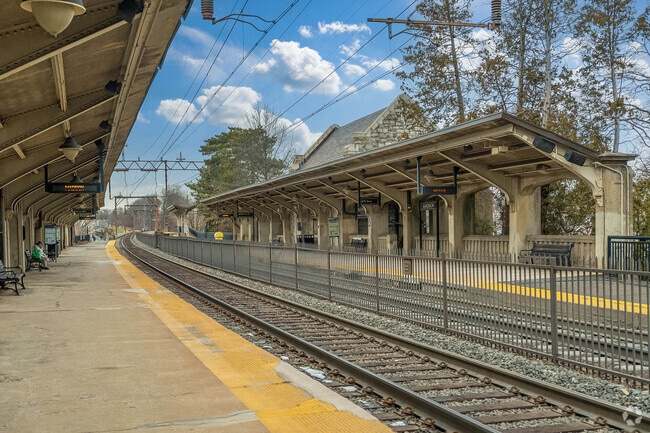
Madison Train Station connects residents to Newark and beyond.
Hartley Dodge Memorial stands tall in Madison, NJ.
Sunday Motor Cafe is a local favorite.
Drew University calls Madison home.
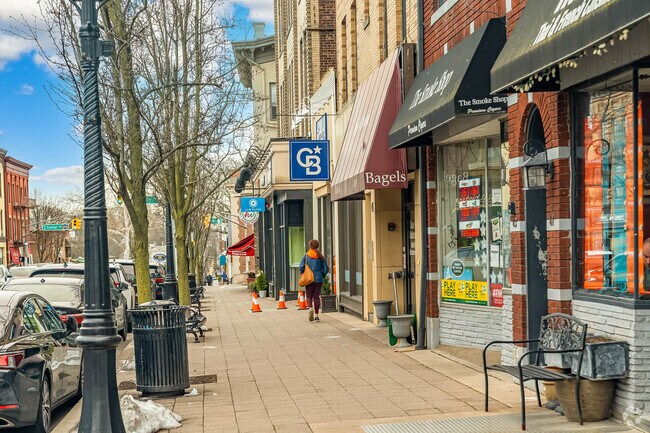
Downtown Madison is always busy.
Dodge field gets packed on weekends.
Median Household Income
$161,855
Average: $181,314
Education
8,185
Residents Have a Degree
Job Market
8,656
Workers Employed
Median Age
38 Years
Largest Age Group
15-24 Years
Approximately 17% of Residents
Under 20
25%
Over 65
16%
Housing Distribution
Madison has more homeowners than renters.

Education Distribution
Review this city's overall education levels.

As of July 2026, the average apartment rent in Madison, NJ is $2,291 for a studio, $2,661 for one bedroom, $3,531 for two bedrooms, and $4,238 for three bedrooms. Apartment rent in Madison has decreased by -0.3% in the past year.
Explore how walkable, bikeable, drivable, and transit-friendly Madison, NJ is for everyday living.
Moderately Walkable
Walkability
Good Public Transit
Transit
Very Drivable
Drivability
Fairly Bikeable
Bikeability
Central Avenue Elementary School
Public
Grades PK-5
492 Students

Public
Grades K-5
275 Students
Torey J. Sabatini Elementary School
Public
Grades K-5
281 Students

Public
Grades 6-8
579 Students

Public
Grades 9-12
761 Students
† Our analysis of utilities, groceries, transportation, healthcare, home prices, and other goods and services is sourced from the Cost of Living Index, a respected benchmark published by the Council for Community and Economic Research (C2ER) that provides a thorough overview of living expenses across different regions.
Rent data is provided by CoStar Group’s Market Trend reports. As the industry leader in commercial real estate information, analytics, and news, CoStar conducts extensive research to produce and maintain a comprehensive database of commercial real estate information. We combine this data with public record to provide the most up-to-date rental information available.
Consumer goods, services, and home prices are sourced from the Cost of Living Index published by the Council for Community and Economic Research (C2ER). The data on this page is updated quarterly. It was last published in June 2026.
Demographic information comes from Neustar and combines detailed address data with U.S. Census and American Community Survey statistics to produce reliable local estimates.


