Median Age
34 Years
Largest Age Group
25-34 Years
Approximately 16% of Residents
Under 20
28%
Over 65
12%

Avg Rent
$1,356
Population
60,109
Renter Mix
53% Rent
Vibrant culture and proximity to downtown L.A. beckon you to the city of Lynwood. The community has something for everyone, including diverse cuisine, entertainment venues, and nightlife.
One of the first things you see as you enter Lynwood is its own water tower rising among the many apartments and commercial buildings. As you walk through, you see neatly lined residential areas and sprawling urban spaces intermingling with one another.
This suburban area provides not just cultural diversity, but a wholesome lifestyle filled with greenery at Lynwood Park, open spaces, and pools. Restaurants are found along its major thoroughfares, and residents have direct access to Interstates 105 and 210.
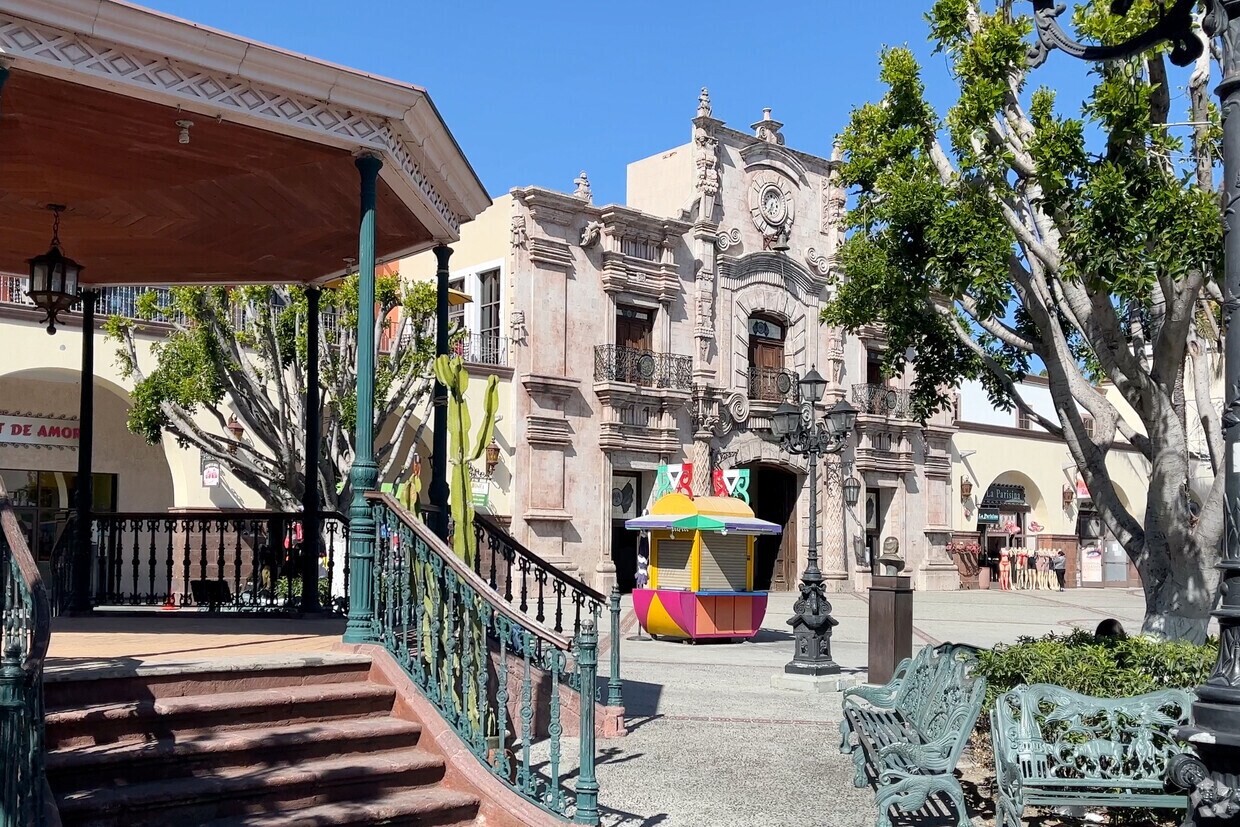
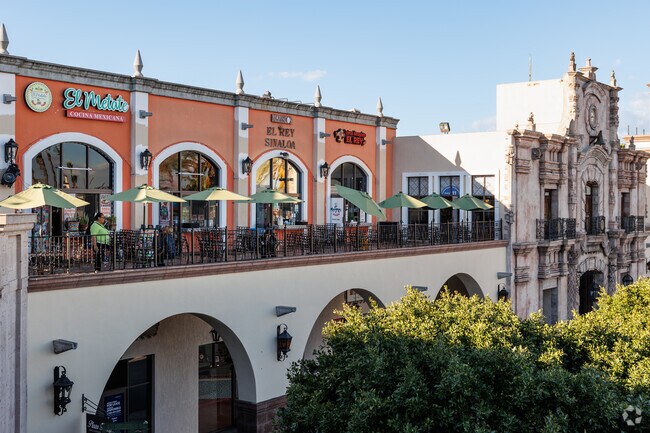
Plaza Mexico in Lynwood has a ton of dining options for you and your family.
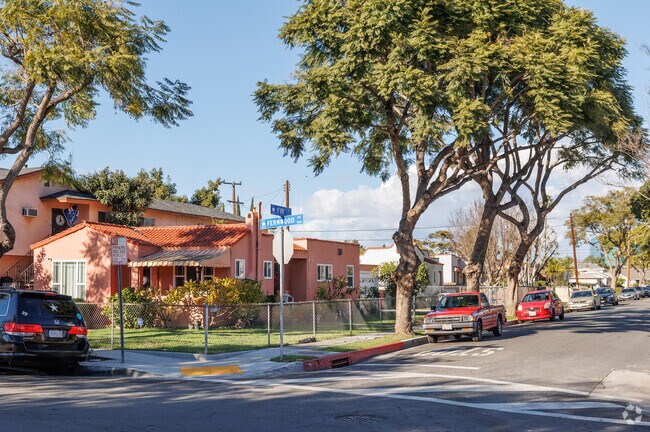
Find quaint homes with orange Spanish style roofs in Lynwood.
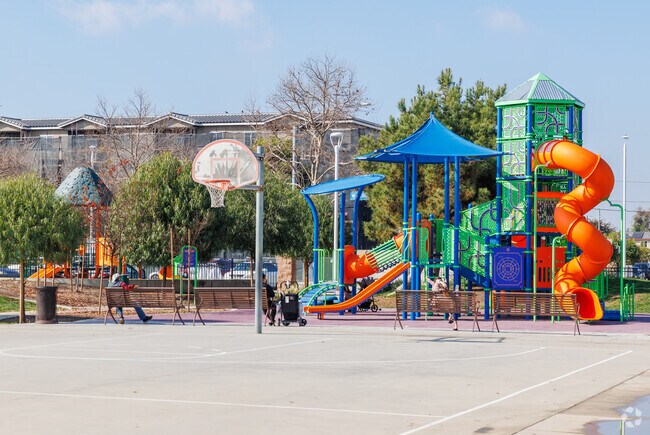
Enjoy the playground at Yvonne Burke John D. Ham Park in Lynwood.
Median Household Income
$63,904
Average: $80,689
Education
5,845
Residents Have a Degree
Job Market
26,285
Workers Employed
Median Age
34 Years
Largest Age Group
25-34 Years
Approximately 16% of Residents
Under 20
28%
Over 65
12%
Housing Distribution
Lynwood has more renters than homeowners.

Education Distribution
Review this city's overall education levels.

As of July 2026, the average apartment rent in Lynwood, CA is $1,487 for a studio, $1,356 for one bedroom, $1,686 for two bedrooms, and $2,108 for three bedrooms. Apartment rent in Lynwood has increased by 3.4% in the past year.
Explore how walkable, bikeable, drivable, and transit-friendly Lynwood, CA is for everyday living.
Moderately Walkable
Walkability
Some Public Transit
Transit
Exceptionally Drivable
Drivability
Moderately Bikeable
Bikeability
Public
Grades K-5
492 Students

Public
Grades K-5
492 Students
Helen Keller Elementary School
Public
Grades K-5
407 Students

Public
Grades K-5
407 Students
Public
Grades K-5
684 Students

Public
Grades 6-8
882 Students

Public
Grades 6-8
882 Students

Public
Grades 6-8
754 Students
Public
Grades 6-8
754 Students
Public
Grades 7-8
1,058 Students

Public
Grades 9-12
1,858 Students

Public
Grades 9-12
1,858 Students
Public
Grades 9-12
1,633 Students
Marco Antonio Firebaugh High School
Public
Grades 9-12
1,633 Students
Vista High (Continuation) School
Public
Grades 9-12
186 Students
† Our analysis of utilities, groceries, transportation, healthcare, home prices, and other goods and services is sourced from the Cost of Living Index, a respected benchmark published by the Council for Community and Economic Research (C2ER) that provides a thorough overview of living expenses across different regions.
Rent data is provided by CoStar Group’s Market Trend reports. As the industry leader in commercial real estate information, analytics, and news, CoStar conducts extensive research to produce and maintain a comprehensive database of commercial real estate information. We combine this data with public record to provide the most up-to-date rental information available.
Consumer goods, services, and home prices are sourced from the Cost of Living Index published by the Council for Community and Economic Research (C2ER). The data on this page is updated quarterly. It was last published in June 2026.
Demographic information comes from Neustar and combines detailed address data with U.S. Census and American Community Survey statistics to produce reliable local estimates.


")


