Median Age
40 Years
Largest Age Group
35-44 Years
Approximately 16% of Residents
Under 20
26%
Over 65
20%

Area Guide
Avg Rent
$727
Population
18,259
Renter Mix
25% Rent
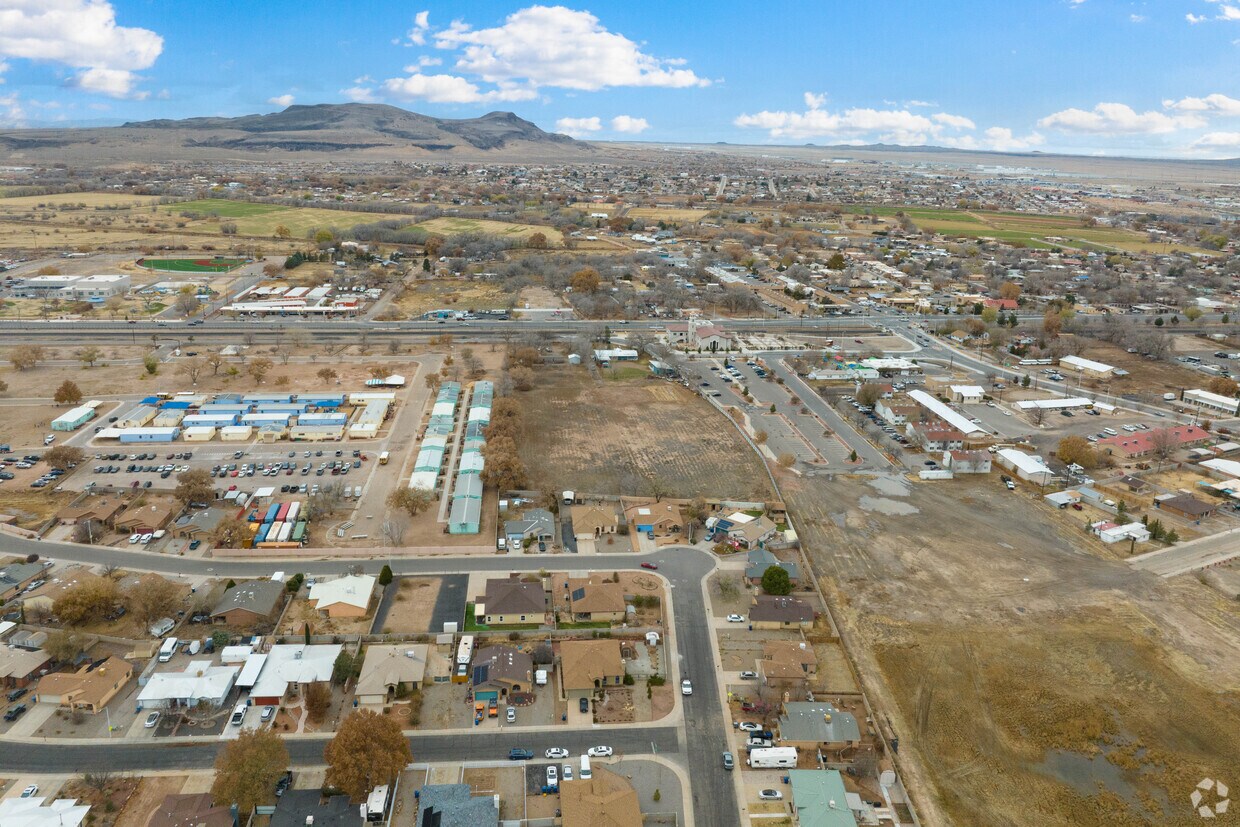
Los Lunas sits about 22 miles south of Albuquerque as the county seat of Valencia County, carrying a history that stretches back to a Spanish land grant made to the Luna family in the early 18th century. The village has grown steadily into one of New Mexico's more accessible small communities, offering proximity to a major metro while holding onto a quieter, more grounded pace of life. The nearby Rio Grande and the Sandia Mountains in the distance give the area a sense of place that's hard to manufacture.
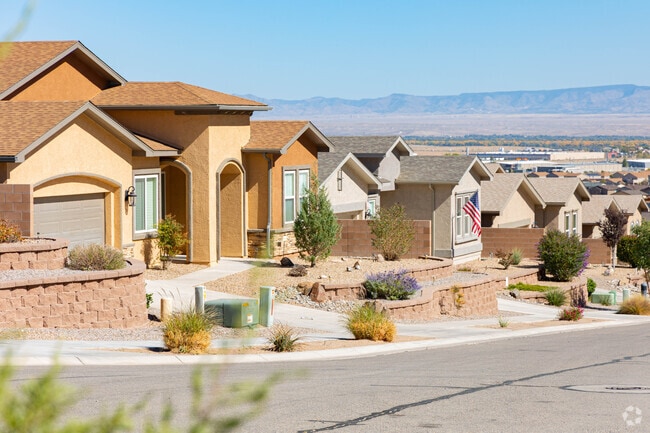
Most of Los Lunas is residential in character, with housing that skews toward single-story homes and smaller apartment communities rather than high-rises or dense urban development. Renters will find a range of options, from modest one-bedroom units to larger multi-bedroom layouts suited to those wanting more space. Main Street corridors provide everyday conveniences, and the New Mexico Rail Runner station connects residents to Albuquerque without needing to navigate the interstate daily. New Mexico Highlands University maintains a presence in the region, and the broader Albuquerque metro's economy in healthcare, government, and technology is within easy reach for those who commute northward.
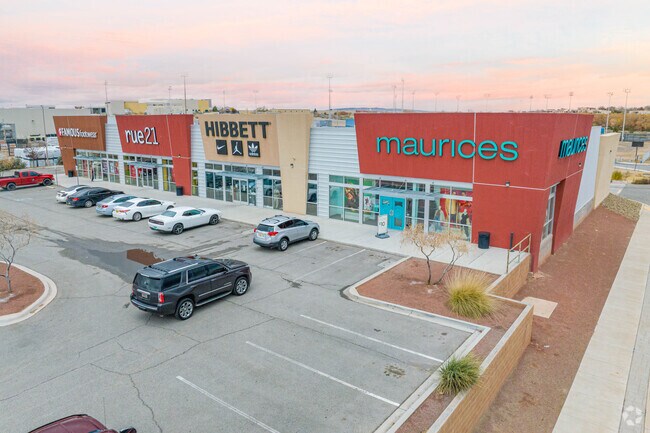
Several clothing stores available to residents in Los Lunas.
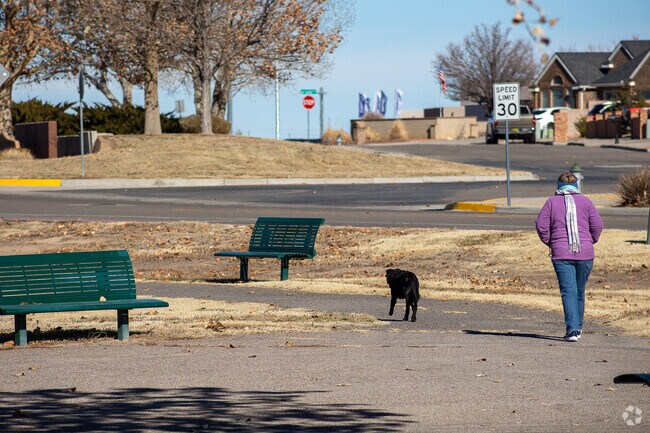
You will often find Los Lunas residents outside with their dogs.
Enjoy the large cottonwoods along the Bosque at Riverside Park in Los Lunas.
Commuters board the Rail Runner in Los Lunas.
Huning Ranch Park features a dog park, tennis courts, grass field, playground and more.
The Los Lunas Sports Complex has many sports fields for residents to enjoy.
Median Household Income
$59,531
Average: $75,324
Education
3,641
Residents Have a Degree
Job Market
7,893
Workers Employed
Median Age
40 Years
Largest Age Group
35-44 Years
Approximately 16% of Residents
Under 20
26%
Over 65
20%
Housing Distribution
Los Lunas has more homeowners than renters.

Education Distribution
Review this city's overall education levels.

As of June 2026, the average apartment rent in Los Lunas, NM is $728 for one bedroom, $943 for two bedrooms, and $1,323 for three bedrooms. Apartment rent in Los Lunas has increased by 2.5% in the past year.
Explore how walkable, bikeable, drivable, and transit-friendly Los Lunas, NM is for everyday living.
Somewhat Walkable
Walkability
Limited Public Transit
Transit
Exceptionally Drivable
Drivability
Somewhat Bikeable
Bikeability
Public
Grades PK-5
635 Students

Katherine Gallegos Elementary School
Public
Grades PK-5
635 Students
Bosque Farms Elementary School
Public
Grades PK-5
457 Students
Public
Grades PK-5
457 Students
Public
Grades PK-5
561 Students

Public
Grades 6-8
799 Students
Public
Grades 6-8
799 Students
Public
Grades 6-8
492 Students
Public
Grades PK-12
606 Students

Public
Grades PK-12
606 Students
Public
Grades 9-12
1,486 Students

Public
Grades 9-12
887 Students
Public
Grades 9-12
887 Students
† Our analysis of utilities, groceries, transportation, healthcare, home prices, and other goods and services is sourced from the Cost of Living Index, a respected benchmark published by the Council for Community and Economic Research (C2ER) that provides a thorough overview of living expenses across different regions.
Rent data is provided by CoStar Group’s Market Trend reports. As the industry leader in commercial real estate information, analytics, and news, CoStar conducts extensive research to produce and maintain a comprehensive database of commercial real estate information. We combine this data with public record to provide the most up-to-date rental information available.
Consumer goods, services, and home prices are sourced from the Cost of Living Index published by the Council for Community and Economic Research (C2ER). The data on this page is updated quarterly. It was last published in June 2026.
Demographic information comes from Neustar and combines detailed address data with U.S. Census and American Community Survey statistics to produce reliable local estimates.


