
5 Most Affordable Neighborhoods in Lexington, KY
Experience all Lexington offers without breaking the bank. Explore our detailed guide to moving to Lexington on a budget.


Avg Rent
$1,125
Population
319,717
Renter Mix
48% Rent
Regarded as the Horse Capital of the World, Lexington is home to a number of horse farms and all kinds of equestrian events. The second largest city in Kentucky, Lexington maintains a small-town feel and progressive atmosphere thanks to an involved community and the presence of three colleges — the University of Kentucky, Transylvania University, and Bluegrass Community and Technical College.
There is something for everyone in Lexington. Sports fans enjoy the horse races at the Red Mile and Wildcats basketball games at Rupp Arena. Outdoor enthusiasts delight in the city’s thriving cycling community, as well as hiking the many trails in and near Lexington. History buffs relish access to the Mary Todd Lincoln House and Ashland: the Henry Clay Estate. Art lovers savor the plentiful art galleries, including Lexington Art League, Institute 193, and the Lyric Theatre and Cultural Center. Shoppers appreciate having the largest mall in Kentucky, Fayette Mall. Everyone in the Lexington community comes together at regular events and festivals such as the Fourth of July Parade, Kentucky Crawfish Festival, and Festival of Bluegrass.
Lexington’s diverse landscape means there’s something for every renter. Whether you’re looking for an apartment near the university or a single-family home in the heart of horse country, this vibrant city suits every budget and style.
Fun events happen all the time in Lexington.
Shopping opportunities are everywhere in Lexington.
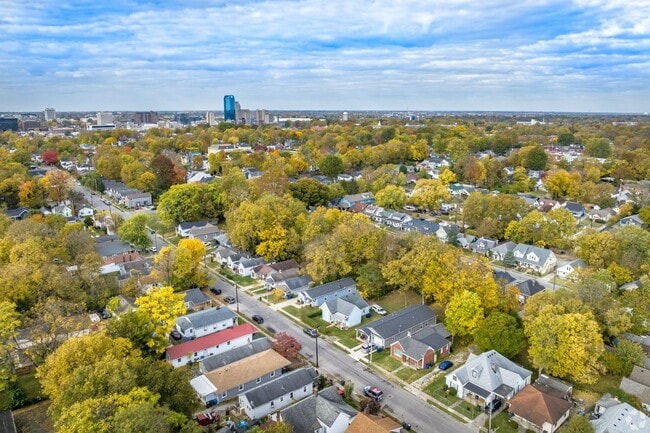
You can live in the city or suburbs of Lexington.
Median Household Income
$62,730
Average: $86,495
Education
116,054
Residents Have a Degree
Job Market
171,261
Workers Employed
Median Age
36 Years
Largest Age Group
20-29 Years
Approximately 17% of Residents
Under 20
24%
Over 65
17%
Housing Distribution
Lexington has more homeowners than renters.

Education Distribution
Review this city's overall education levels.

As of July 2026, the average apartment rent in Lexington, KY is $977 for a studio, $1,123 for one bedroom, $1,401 for two bedrooms, and $1,786 for three bedrooms. Apartment rent in Lexington has increased by 3.5% in the past year.
The cost of living in Lexington, KY is 7.2% lower than the national average. Generally, housing in Lexington is 22.8% less expensive than the national average, with rent falling between $977 - $1,786. You can expect to pay 0.8% more for groceries, 11.9% less for utilities, and 4.4% less for transportation.
Compare Cities

5 Most Affordable Neighborhoods in Lexington, KY
Experience all Lexington offers without breaking the bank. Explore our detailed guide to moving to Lexington on a budget.

How to Conduct a Long-Distance Apartment Search
Long-distance search? Use virtual tours and smart timing to avoid a leap of faith.

4 Simple Steps to Find Your Dream Rental in a Competitive Market
Competing with a dozen renters? These 4 steps help you stand out—and actually get the keys.
Explore how walkable, bikeable, drivable, and transit-friendly Lexington, KY is for everyday living.
Moderately Walkable
Walkability
Limited Public Transit
Transit
Moderately Drivable
Drivability
Fairly Bikeable
Bikeability
Public
Grades K-8
300 Students

Veterans Park Elementary School
Public
Grades K-5
685 Students

Public
Grades K-5
647 Students
Athens-Chilesburg Elementary School
Public
Grades K-5
619 Students
Public
Grades PK-5
618 Students
Public
Grades K-8
300 Students
Edythe Jones Hayes Middle School
Public
Grades 6-8
1,109 Students
Public
Grades 6-8
992 Students

Public
Grades 6-8
735 Students
Public
Grades 6-8
738 Students

Public
Grades 9-12
2,297 Students
Public
Grades 9-12
93 Students
Public
Grades 9-12
422 Students
Public
Grades 9-12
1,888 Students
Frederick Douglass High School
Public
Grades 9-12
1,782 Students
† Our analysis of utilities, groceries, transportation, healthcare, home prices, and other goods and services is sourced from the Cost of Living Index, a respected benchmark published by the Council for Community and Economic Research (C2ER) that provides a thorough overview of living expenses across different regions.
Rent data is provided by CoStar Group’s Market Trend reports. As the industry leader in commercial real estate information, analytics, and news, CoStar conducts extensive research to produce and maintain a comprehensive database of commercial real estate information. We combine this data with public record to provide the most up-to-date rental information available.
Consumer goods, services, and home prices are sourced from the Cost of Living Index published by the Council for Community and Economic Research (C2ER). The data on this page is updated quarterly. It was last published in June 2026.
Demographic information comes from Neustar and combines detailed address data with U.S. Census and American Community Survey statistics to produce reliable local estimates.


