
Skyhouse Apartments
335 N Magnolia Ave,
Orlando, FL 32801
$1,556 - $3,520
Studio - 3 Beds


Giant, fake swans – and some real ones – circle the fountain of Lake Eola. The fake ones are paddle boats, rented by residents and visitors for relaxation and amazing views of the Downtown Orlando skyline. The Lake Eola neighborhood consists of the historic Eola Heights and South Eola. The large lake is the star of both communities.
Eola Heights features brick-paved streets shaded by oak trees and is a short walk to Lake Eola Park. It is also within walking distance of South Eola, which is a shopping, dining, and entertainment hub. These two very distinctive neighborhoods combine to provide the best of Orlando – natural beauty, history, fun events, and the Orlando Farmers Market.
Eola Heights extends from East Colonial Drive to the north end of Lake Eola Park. South Eola is located on the southeast side of the lake and is the location of the farmers market, the Stardust Lounge, and the World of Beer.
A swan on Lake Eola
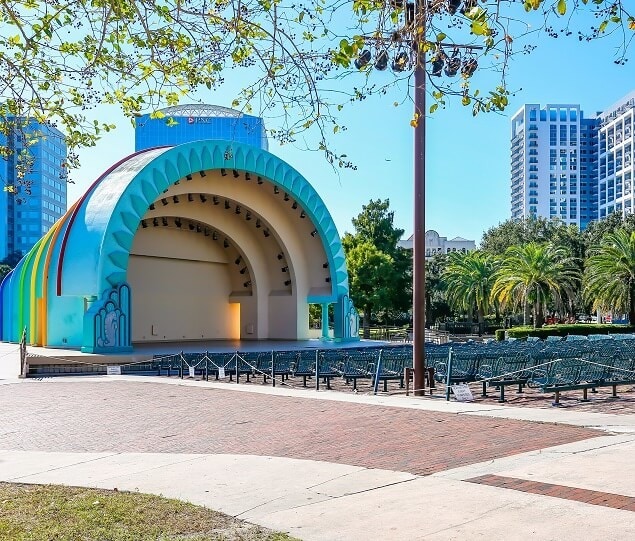
The Walt Disney Amphitheatre is the go-to spot for concerts and events
Sit back and relax in the hand of the Muse of Discovery sculpture
A view of Lake Eola Park and the amphitheater
As of March 2026, the average apartment rent in Lake Eola is $1,616 for a studio, $2,038 for one bedroom, $2,621 for two bedrooms, and $3,601 for three bedrooms. Apartment rent in Lake Eola has increased by 1.8% in the past year.
Studio
660 sq ft
Average Sq Ft
$1,616/month
Average Rent
1 BR
774 sq ft
Average Sq Ft
$2,038/month
Average Rent
2 BR
1,141 sq ft
Average Sq Ft
$2,621/month
Average Rent
3 BR
1,610 sq ft
Average Sq Ft
$3,601/month
Average Rent
Explore how walkable, bikeable, drivable, and transit-friendly Lake Eola - Orlando, FL is for everyday living.
Walker's Paradise
Lace up your walking shoes because this area is considered a walker’s paradise.
Good Transit
The area around this property has good transit with many nearby transportation options.
Very Bikeable
This area is very bikeable. You’ll find a variety of bike paths and lanes.

3,497
Communities
959,606
Units
894
Cities

715
Communities
198,639
Units
339
Cities

628
Communities
175,109
Units
251
Cities

625
Communities
125,220
Units
245
Cities

563
Communities
126,155
Units
222
Cities

459
Communities
108,844
Units
229
Cities
† Our analysis of utilities, groceries, transportation, healthcare, home prices, and other goods and services is sourced from the Cost of Living Index, a respected benchmark published by the Council for Community and Economic Research (C2ER) that provides a thorough overview of living expenses across different regions.
Rent data is provided by CoStar Group’s Market Trend reports. As the industry leader in commercial real estate information, analytics, and news, CoStar conducts extensive research to produce and maintain a comprehensive database of commercial real estate information. We combine this data with public record to provide the most up-to-date rental information available.
Consumer goods, services, and home prices are sourced from the Cost of Living Index published by the Council for Community and Economic Research (C2ER). The data on this page is updated quarterly. It was last published in February 2026.


