
The Q Playa
5901-5921 Center Dr,
Los Angeles, CA 90045
$2,972 - $6,618
1-3 Beds


Welcome to Inglewood, located in the heart of Los Angeles County and emerging as Southern California's sports and entertainment destination. The city features residential options throughout neighborhoods like Morningside Park and Fairview Heights, as well as apartment communities near downtown. Current rental trends show one-bedroom apartments averaging $1,704, while two-bedroom units typically rent for $2,050. The market has remained relatively stable, with only minor fluctuations in pricing over the past year.
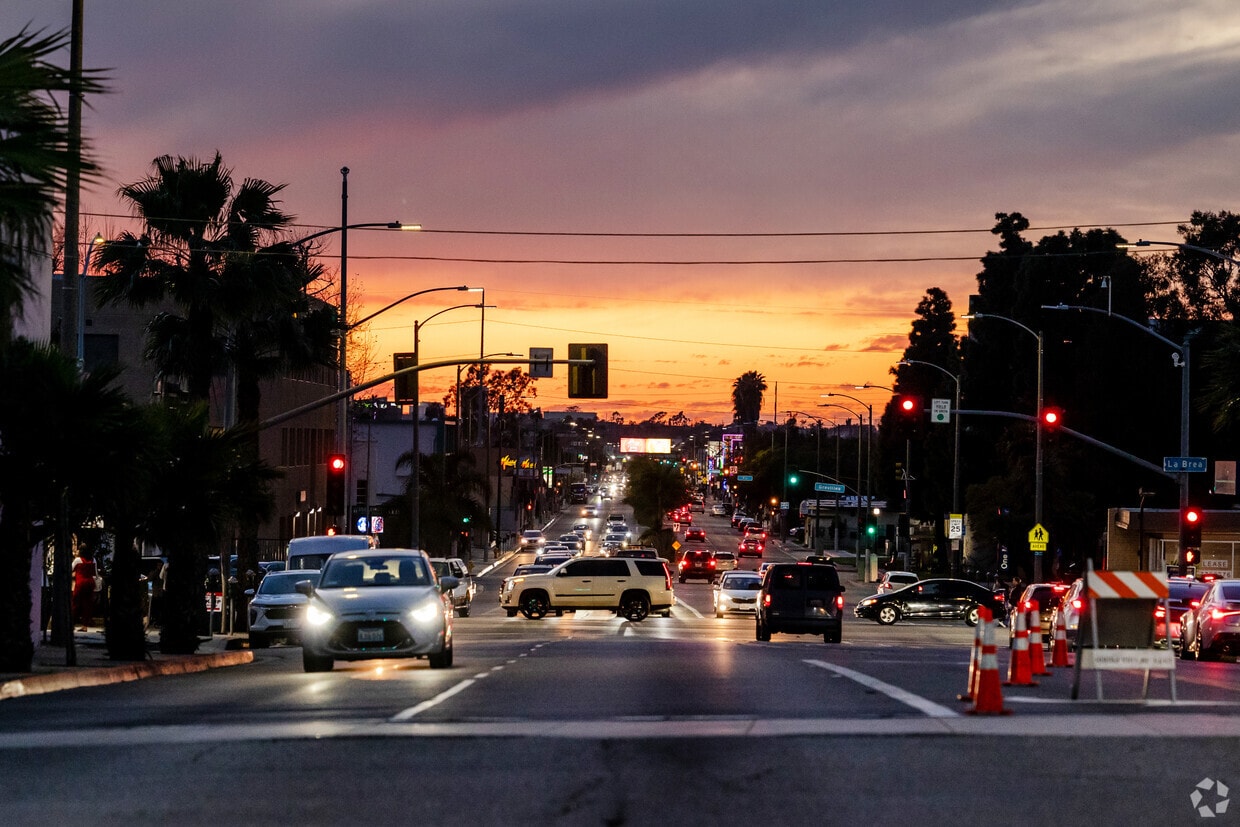
Inglewood's landscape includes SoFi Stadium, home to the NFL's Los Angeles Rams and Chargers, and the historic Kia Forum, a premier entertainment venue. The Intuit Dome, home court for the NBA's Los Angeles Clippers, further enhances the area's sports presence. Edward Vincent Sr. Park, featuring the historic Centinela Springs, provides outdoor recreation space for residents. Market Street in downtown offers an array of local restaurants representing the area's cultural diversity. Three K Line Metro stations provide connections throughout Los Angeles, and the proximity to LAX offers convenient travel options. Established in 1888, Inglewood combines its historic roots with contemporary development, particularly evident in its sports venues and entertainment district.
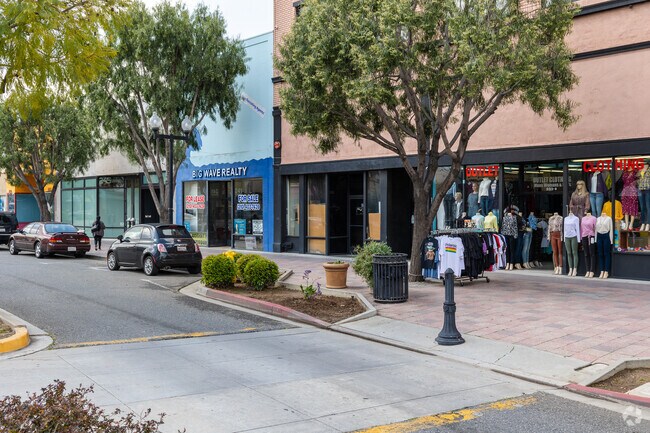
Locals can stroll along Market Street in Inglewood, CA.
Head to SoFi Stadium on to watch the LA Rams or Chargers in Morningside Park, CA.
Inglewood has a rich culture, many events and cultural programs for its residents.
Edward Vincent Park in Inglewood provides 8 tennis courts to choose from.
Inglewood Knolls families can enjoy a day at one of the parks in the Inglewood neighborhood.
The beach at Venice is the most popular attraction of the neighborhood.
As of April 2026, the average apartment rent in Inglewood, CA is $1,561 for a studio, $1,742 for one bedroom, $2,112 for two bedrooms, and $2,711 for three bedrooms. Apartment rent in Inglewood has increased by 0.6% in the past year.
Explore how walkable, bikeable, drivable, and transit-friendly Inglewood, CA is for everyday living.
Moderately Walkable
Walkability
Some Public Transit
Transit
Very Drivable
Drivability
Fairly Bikeable
Bikeability
Wilder's Preparatory Academy Charter
Public
Grades K-5

La Tijera K-8 Charter School Academy of Excellence
Public
Grades K-8

Public
Grades K-8

Public
Grades K-5
Public
Grades K-8

Environmental Charter Middle - Inglewood
Public
Grades 6-8

Wilder's Preparatory Academy Charter Middle
Public
Grades 6-8
Public
Grades 6-8
La Tijera K-8 Charter School Academy of Excellence
Public
Grades K-8
Public
Grades K-8
Lennox Mathematics, Science And Technology Academy
Public
Grades 9-12
Public
Grades 9-12
Public
Grades 9-12
City Honors College Preparatory Charter School
Public
Grades 9-12
Animo City Of Champions Charter High
Public
Grades 9-12

122
Communities
3,748
Units
32
Cities

3,481
Communities
958,281
Units
891
Cities

67
Communities
3,303
Units
25
Cities

64
Communities
1,462
Units
16
Cities

20
Communities
1,640
Units
8
Cities

22
Communities
1,635
Units
13
Cities
† Our analysis of utilities, groceries, transportation, healthcare, home prices, and other goods and services is sourced from the Cost of Living Index, a respected benchmark published by the Council for Community and Economic Research (C2ER) that provides a thorough overview of living expenses across different regions.
Rent data is provided by CoStar Group’s Market Trend reports. As the industry leader in commercial real estate information, analytics, and news, CoStar conducts extensive research to produce and maintain a comprehensive database of commercial real estate information. We combine this data with public record to provide the most up-to-date rental information available.
Consumer goods, services, and home prices are sourced from the Cost of Living Index published by the Council for Community and Economic Research (C2ER). The data on this page is updated quarterly. It was last published in February 2026.
Demographic information comes from Neustar and combines detailed address data with U.S. Census and American Community Survey statistics to produce reliable local estimates.


")


