
Avana Thornblade
100 Mary Rose Ln,
Greer, SC 29650
$1,274 - $5,030 Total Monthly Price
1-3 Beds
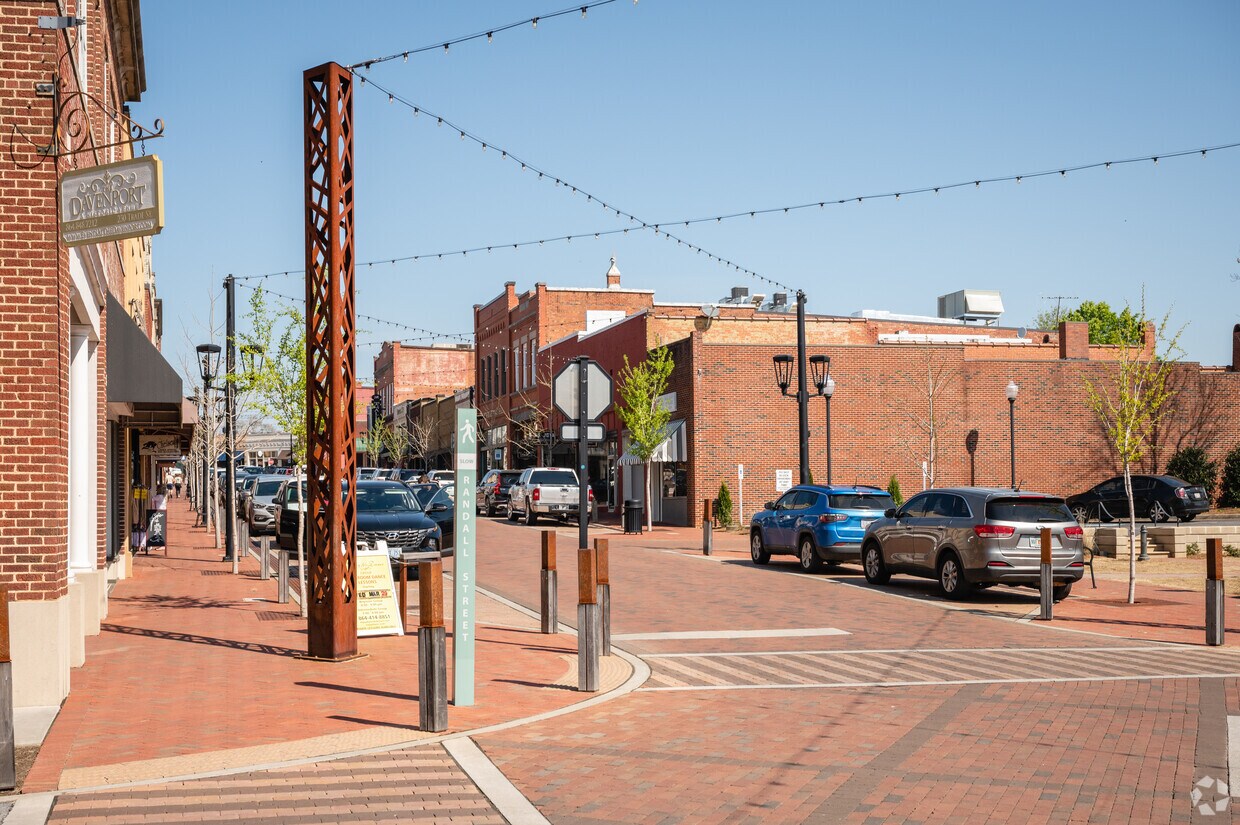
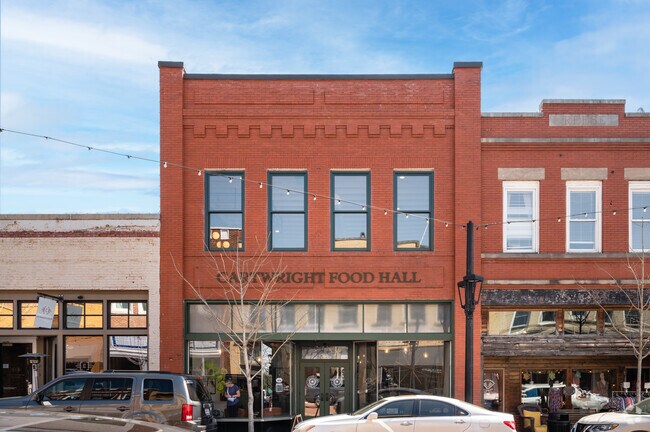
Located in Upstate South Carolina, Greer combines hometown appeal with contemporary living options. Positioned between Greenville and Spartanburg, this growing city features Greer Station, a downtown district where preserved historic buildings house local shops and restaurants. The rental market offers various options, with average monthly rates ranging from $1,286 for one-bedroom units to $1,875 for three-bedroom homes. While two-bedroom rates have decreased by 3.4%, larger units have seen modest increases, yet Greer's rental prices remain competitive with surrounding cities. Established neighborhoods include the downtown area and the communities near BMW Manufacturing, one of the area's largest employers.
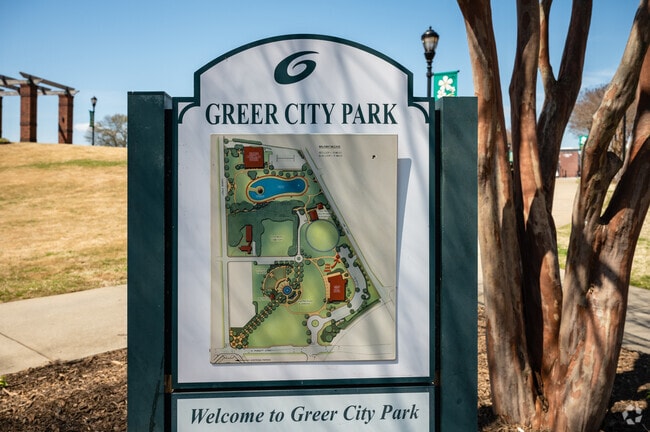
Outdoor recreation centers around three lakes - Apalache, Robinson, and Cunningham - while the 12-acre Greer City Park hosts community festivals and events throughout the year. The city's proximity to Greenville-Spartanburg International Airport and the South Carolina Inland Port has strengthened its economic foundation. Since its establishment in 1876 as a railway stop, Greer has maintained its historic architecture while accommodating growth. Residents benefit from healthcare access at Pelham Medical Center and Greer Memorial Hospital, while enjoying local events that showcase the community's heritage.
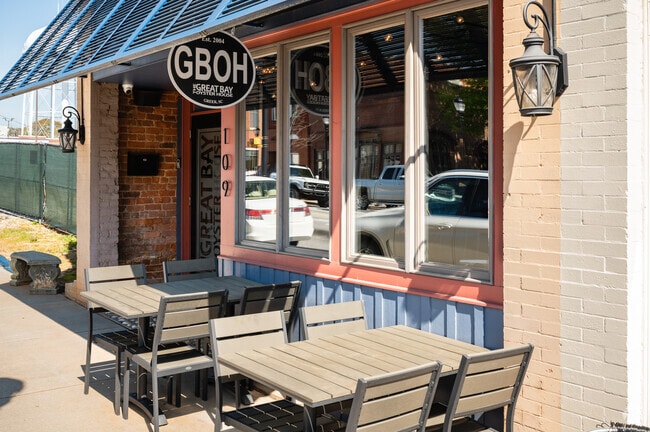
Great Bay Oyster House Entrance
Greer City Park Sign
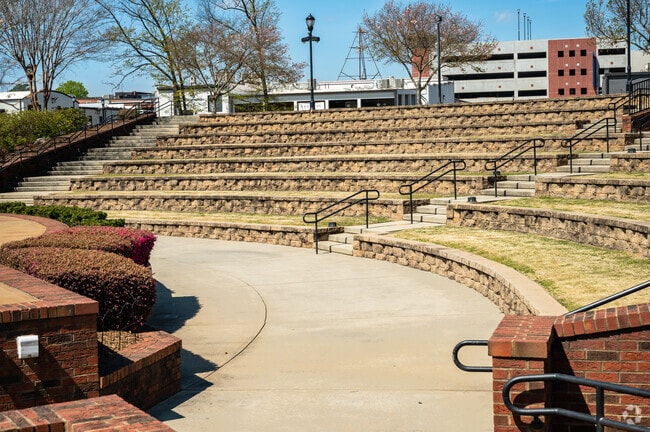
Greer City Park Amphitheater Seating
Fountain and Plants at the Greer City Park
Main Path at the Greer City Park
Trade Street from the Air
As of March 2026, the average apartment rent in Greer, SC is $1,226 for a studio, $1,301 for one bedroom, $1,540 for two bedrooms, and $1,804 for three bedrooms. Apartment rent in Greer has decreased by -1.2% in the past year.
Explore how walkable, bikeable, drivable, and transit-friendly Greer, SC is for everyday living.
Car-Dependent
This area is considered a car-dependent area and most errands will require a car.
Minimal Transit
You'll likely want a car when living in this area since it has few transit options.
Somewhat Bikeable
You might be able to find places to ride your bike in this area, but you’ll most likely want your car for most errands.
Public
Grades K-5

Public
Grades PK-5

Public
Grades PK-5
Public
Grades PK-5

Public
Grades PK-5

Public
Grades 6-8
Public
Grades 6-8

Public
Grades 6-8


3,490
Communities
959,772
Units
895
Cities

144
Communities
19,026
Units
116
Cities

715
Communities
198,674
Units
340
Cities

294
Communities
78,103
Units
169
Cities

102
Communities
24,618
Units
59
Cities

54
Communities
13,127
Units
41
Cities
† Our analysis of utilities, groceries, transportation, healthcare, home prices, and other goods and services is sourced from the Cost of Living Index, a respected benchmark published by the Council for Community and Economic Research (C2ER) that provides a thorough overview of living expenses across different regions.
Rent data is provided by CoStar Group’s Market Trend reports. As the industry leader in commercial real estate information, analytics, and news, CoStar conducts extensive research to produce and maintain a comprehensive database of commercial real estate information. We combine this data with public record to provide the most up-to-date rental information available.
Consumer goods, services, and home prices are sourced from the Cost of Living Index published by the Council for Community and Economic Research (C2ER). The data on this page is updated quarterly. It was last published in February 2026.


