
The Gateway
460 Davis Ct,
San Francisco, CA 94111
$3,503 - $10,249
Studio - 4 Beds

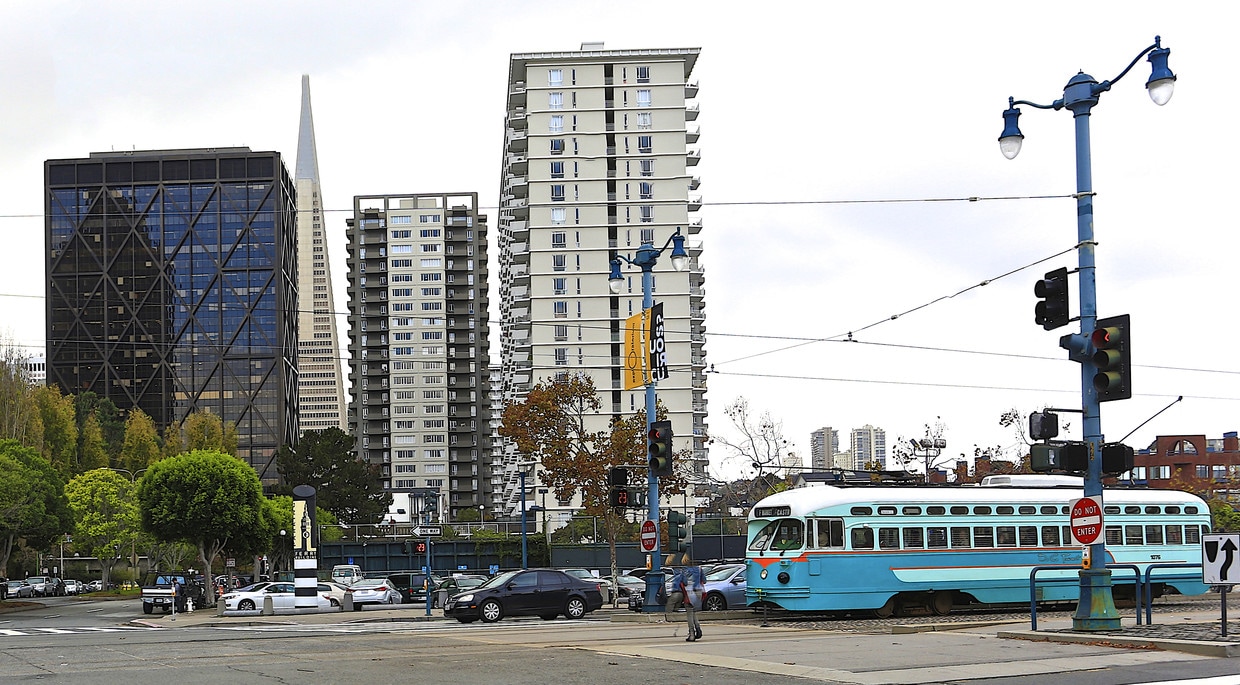

Appropriately named, the Financial District of San Francisco is the central working district in the city. Law firms, corporate offices, banks, and Fortune 500 companies are a few of the financial institutions that occupy the area. This industry-based neighborhood offers abundant restaurants and shopping opportunities as well. The Financial District sits next door to Chinatown and Union Square, a vibrant neighborhood offering upscale shops, restaurants, hotels, and nightlife. Residents of this district enjoy the upscale, high-rise apartments towering over the city and the modern apartment buildings in a central location.
The Financial District occupies much of north Market and Mission Streets in the northeast portion of San Francisco. Conveniently located near bus lines, train lines, ferries, and freeways, this neighborhood’s central location serves thousands of daily commuters.
As of March 2026, the average apartment rent in Financial District is $3,803 for a studio, $4,572 for one bedroom, $6,095 for two bedrooms, and $6,669 for three bedrooms. Apartment rent in Financial District has increased by 21.5% in the past year.
Studio
534 sq ft
Average Sq Ft
$3,803/month
Average Rent
1 BR
713 sq ft
Average Sq Ft
$4,572/month
Average Rent
2 BR
994 sq ft
Average Sq Ft
$6,095/month
Average Rent
3 BR
1,533 sq ft
Average Sq Ft
$6,669/month
Average Rent
Walker's Paradise
out of 100 WalkScore® Rating
Lace up your walking shoes because this area is considered a walker’s paradise.
Rider's Paradise
out of 100 TransitScore® Rating
Living in this area is considered a rider’s paradise, with world-class transportation.
Very Bikeable
out of 100 BikeScore® Rating
This area is very bikeable. You’ll find a variety of bike paths and lanes.

3,467
Communities
954,552
Units
893
Cities

714
Communities
198,723
Units
339
Cities

623
Communities
124,974
Units
245
Cities

620
Communities
172,612
Units
246
Cities

548
Communities
122,772
Units
218
Cities

459
Communities
108,697
Units
230
Cities
† Our analysis of utilities, groceries, transportation, healthcare, home prices, and other goods and services is sourced from the Cost of Living Index, a respected benchmark published by the Council for Community and Economic Research (C2ER) that provides a thorough overview of living expenses across different regions.
Rent data is provided by CoStar Group’s Market Trend reports. As the industry leader in commercial real estate information, analytics, and news, CoStar conducts extensive research to produce and maintain a comprehensive database of commercial real estate information. We combine this data with public record to provide the most up-to-date rental information available.
Consumer goods, services, and home prices are sourced from the Cost of Living Index published by the Council for Community and Economic Research (C2ER). The data on this page is updated quarterly. It was last published in February 2026.

