
The Hammocks at MillCreek
4500 Hammocks Dr,
Erie, PA 16506
$1,695 - $3,270
1-3 Beds
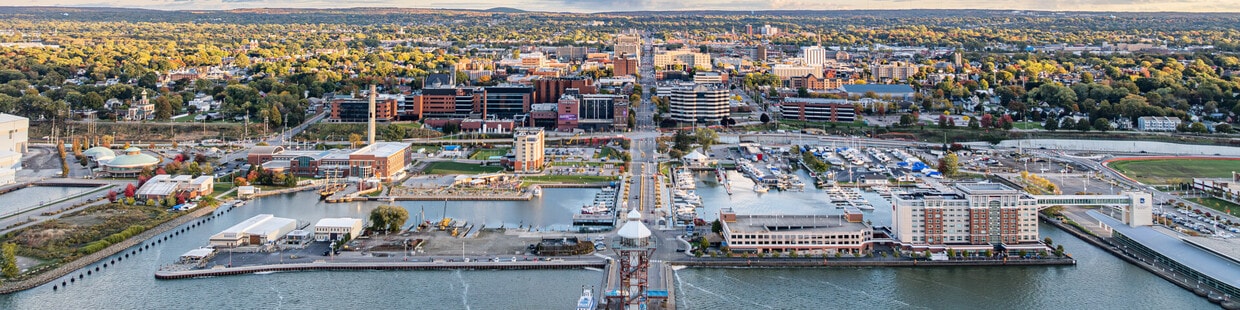


Located on the shores of Lake Erie in Northwestern Pennsylvania, Erie combines waterfront charm with city conveniences. The city's centerpiece, Presque Isle State Park, creates a protected harbor and offers 7 miles of public beaches, wetlands, and outdoor activities. Downtown Erie continues to grow with additions like the Flagship City Food Hall and Public Market, while the restored Warner Theatre, Erie Art Museum, and Maritime Museum showcase the area's rich culture and history. The rental market shows steady growth, with average one-bedroom apartments renting for $918, reflecting a 6% annual increase, while two-bedroom units average $1,329, up 6.1% from the previous year.
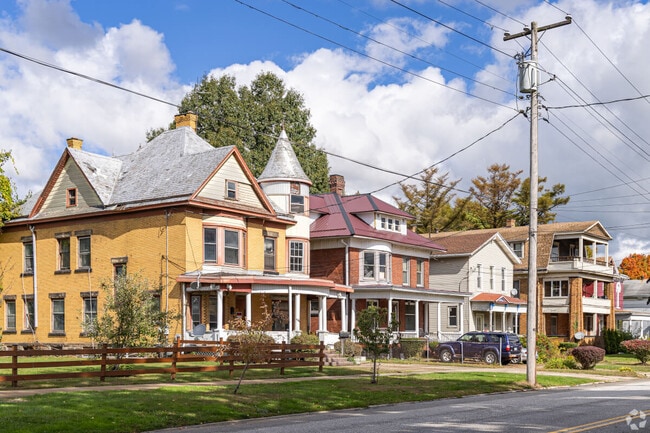
Erie's neighborhoods range from historic West 6th Street, known for its preserved Victorian architecture, to newer developments in the surrounding suburbs. Several higher education institutions, including Gannon University, Mercyhurst University, and Penn State Behrend, contribute to the area's educational landscape. The four-season climate supports both summer beach activities and winter recreation, with the area receiving over 100 inches of lake-effect snow annually. The redeveloped Bayfront district features the Bicentennial Tower, which overlooks Lake Erie, while seasonal events and festivals celebrate the city's maritime heritage.
Residents love lakefront activities like fishing.
Homes in Erie can be affordable or expensive.
Downtown Erie is a hub activity with museums, theaters, and more.
As of March 2026, the average apartment rent in Erie, PA is $910 for a studio, $958 for one bedroom, $1,419 for two bedrooms, and $1,673 for three bedrooms. Apartment rent in Erie has increased by 2.6% in the past year.
The cost of living in Erie, PA is 13.6% lower than the national average. Generally, housing in Erie is 44.7% less expensive than the national average, with rent falling between $910 - $1,673. You can expect to pay 3.3% less for groceries, 8.9% more for utilities, and 14.0% more for transportation.
Somewhat Walkable
out of 100 WalkScore® Rating
You might be able to get out and walk when living in this area. Some errands can be accomplished on foot, but for others you’ll need a car.
Minimal Transit
out of 100 TransitScore® Rating
You'll likely want a car when living in this area since it has few transit options.
Somewhat Bikeable
out of 100 BikeScore® Rating
You might be able to find places to ride your bike in this area, but you’ll most likely want your car for most errands.
Public
Grades K-4
455 Students

Public
Grades K-5
659 Students

Public
Grades 5-8
409 Students
Public
Grades K-5
381 Students
Chestnut Hill Elementary School
Public
Grades K-5
365 Students
Public
Grades 5-8
409 Students
Public
Grades 6-8
550 Students

Public
Grades 6-8
729 Students

Iroquois Junior-Senior High School
Public
Grades 7-12
539 Students
Public
Grades PK & 6-8
470 Students
Northwest Pa Collegiate Academy
Public
Grades 9-12
753 Students
Public
Grades PK & 9-12
2,205 Students
Public
Grades 9-12
389 Students

Iroquois Junior-Senior High School
Public
Grades 7-12
539 Students
Public
Grades 9-12
685 Students

22
Communities
3,542
Units
13
Cities

315
Communities
76,965
Units
144
Cities
62
Communities
7,481
Units
53
Cities
72
Communities
14,446
Units
45
Cities

11
Communities
1,854
Units
11
Cities

15
Communities
2,098
Units
10
Cities
† Our analysis of utilities, groceries, transportation, healthcare, home prices, and other goods and services is sourced from the Cost of Living Index, a respected benchmark published by the Council for Community and Economic Research (C2ER) that provides a thorough overview of living expenses across different regions.
Rent data is provided by CoStar Group’s Market Trend reports. As the industry leader in commercial real estate information, analytics, and news, CoStar conducts extensive research to produce and maintain a comprehensive database of commercial real estate information. We combine this data with public record to provide the most up-to-date rental information available.
Consumer goods, services, and home prices are sourced from the Cost of Living Index published by the Council for Community and Economic Research (C2ER). The data on this page is updated quarterly. It was last published in February 2026.


