
Cedros Gardens
330 S Cedros Ave,
Solana Beach, CA 92075
$6,100 - $8,000
2 Beds
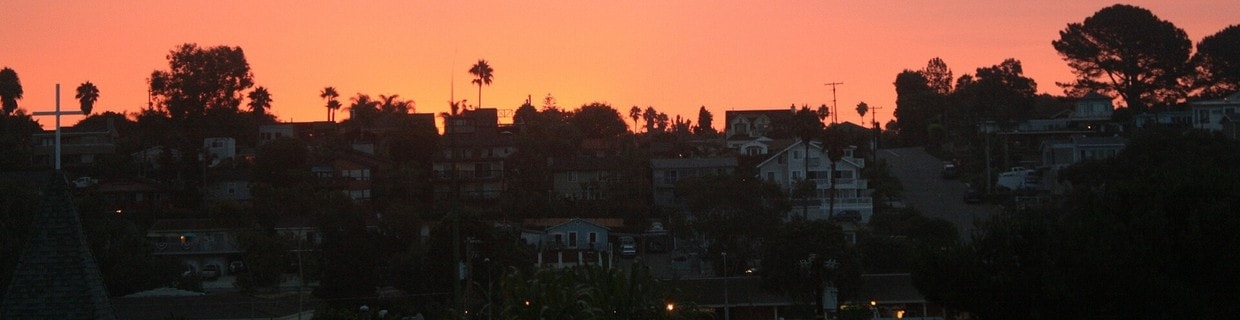

Encinitas spans 19 square miles along Southern California's coastline, offering a perfect mix of beach town atmosphere and coastal living. From beachfront properties to inland residential communities, the area provides diverse housing options. Current rental trends show one-bedroom apartments averaging $2,536, while two-bedroom units typically command $2,988. The historic downtown district along Coast Highway 101 features independent shops, restaurants, and the restored La Paloma Theatre, while neighborhoods like Cardiff-by-the-Sea and Leucadia maintain their individual character with tree-lined streets and local art scenes.
The city is renowned for its outdoor recreation, particularly at Swami's Beach, one of California's premier surfing destinations featured in The Beach Boys' "Surfin' U.S.A." The San Diego Botanic Garden showcases the region's diverse plant life, while Moonlight Beach hosts community events including the annual Switchfoot Bro-Am surf competition. Local traditions include the April Street Fair and the Wavecrest Woodie Meet, celebrating vintage wooden-bodied vehicles. The MiraCosta College San Elijo Campus serves the educational needs of the community.
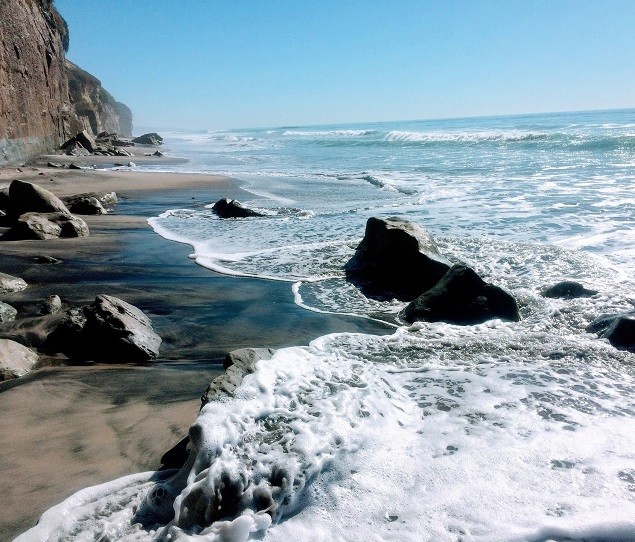
The beaches in Encinitas are world-famous
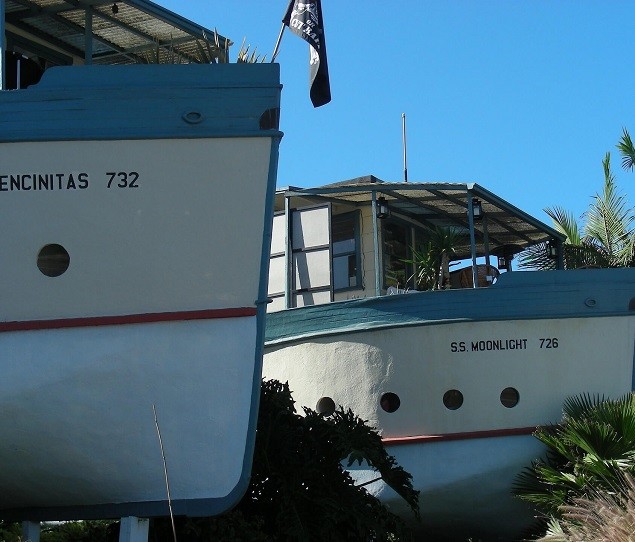
The two boat houses were designed in 1929 and are a local landmark
Beachside Bar and Grill is an Encinitas favorite
The San Diego Botanic Garden covers 37 acres
As of March 2026, the average apartment rent in Encinitas, CA is $2,036 for a studio, $2,424 for one bedroom, $3,080 for two bedrooms, and $3,891 for three bedrooms. Apartment rent in Encinitas has increased by 0.6% in the past year.
Explore how walkable, bikeable, drivable, and transit-friendly Encinitas, CA is for everyday living.
Very Walkable
If you enjoy walking, you’ll enjoy renting in this area! It’s a very walkable neighborhood.
Minimal Transit
You'll likely want a car when living in this area since it has few transit options.
Somewhat Bikeable
You might be able to find places to ride your bike in this area, but you’ll most likely want your car for most errands.
Public
Grades K-5

Public
Grades K-5

Public
Grades K-5
Public
Grades K-5
Public
Grades K-5

Public
Grades 6-8
Public
Grades 6-8

Public
Grades 9-12
Public
Grades 9-12


92
Communities
10,200
Units
38
Cities

84
Communities
13,743
Units
62
Cities

3,490
Communities
959,772
Units
895
Cities

165
Communities
28,614
Units
84
Cities

26
Communities
8,366
Units
24
Cities

31
Communities
8,950
Units
22
Cities
† Our analysis of utilities, groceries, transportation, healthcare, home prices, and other goods and services is sourced from the Cost of Living Index, a respected benchmark published by the Council for Community and Economic Research (C2ER) that provides a thorough overview of living expenses across different regions.
Rent data is provided by CoStar Group’s Market Trend reports. As the industry leader in commercial real estate information, analytics, and news, CoStar conducts extensive research to produce and maintain a comprehensive database of commercial real estate information. We combine this data with public record to provide the most up-to-date rental information available.
Consumer goods, services, and home prices are sourced from the Cost of Living Index published by the Council for Community and Economic Research (C2ER). The data on this page is updated quarterly. It was last published in February 2026.


