
Broadway Village Apartments
36 Broadway Village Dr,
Columbia, MO 65201
$1,250 - $1,400
2 Beds


Welcome to Columbia, Missouri, where education and community spirit meet in the heart of the Show-Me State. As home to the University of Missouri, Columbia combines academic energy with friendly Midwestern charm. The rental market offers diverse options, from downtown apartments averaging $1,126 for a one-bedroom unit to residential neighborhoods, with one-bedroom rental rates showing a 7.6% increase over the past year. The historic East Campus neighborhood features classic architecture steps from campus, while downtown Columbia continues to grow with new residential communities among local shops and cafes.
Columbia's arts scene centers around the restored Missouri Theatre and the annual True/False Film Festival, a celebrated documentary showcase. Outdoor enthusiasts appreciate the MKT Trail, which connects to the Katy Trail State Park, offering miles of paths for walking, running, and cycling. Rock Bridge Memorial State Park showcases Missouri's natural landscape with its cave systems and hiking trails. With three higher education institutions – the University of Missouri, Stephens College, and Columbia College – the city maintains a strong academic presence while offering quality healthcare and entertainment options at reasonable living costs.
Residents of Green Meadows frequently attend the always exciting Mizzou Tigers games.
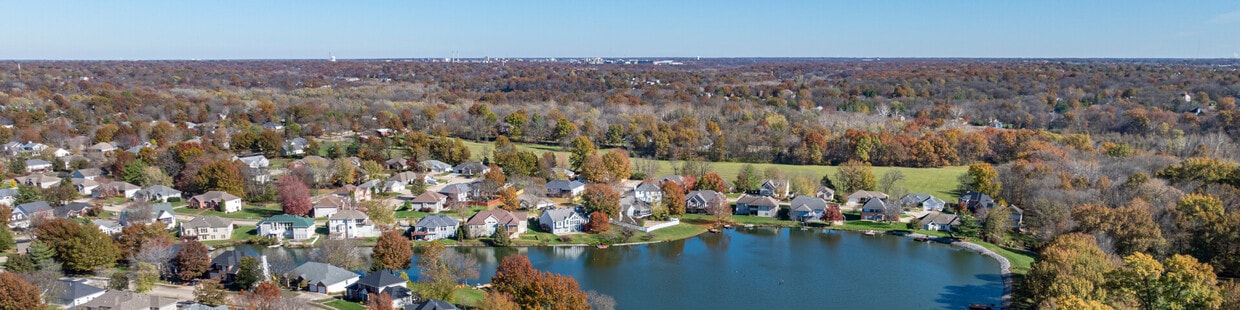
Kings Meadow is a neighborhood full of natural beauty.
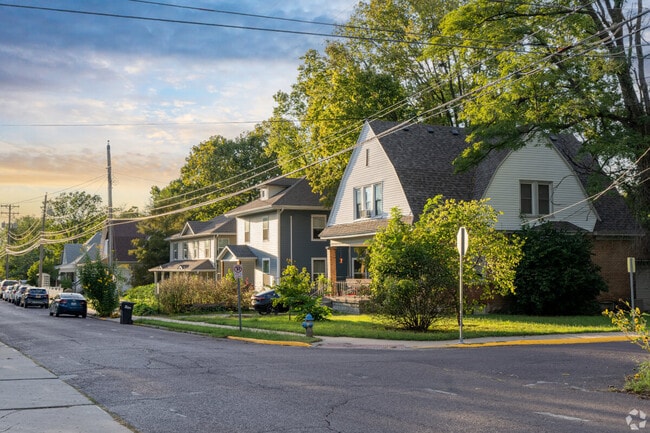
Homes in Benton-Stephens often have large front porches to enjoy the sunset.
As of March 2026, the average apartment rent in Columbia, MO is $1,082 for a studio, $1,236 for one bedroom, $1,244 for two bedrooms, and $1,493 for three bedrooms. Apartment rent in Columbia has increased by 4.0% in the past year.
The cost of living in Columbia, MO is 9.9% lower than the national average. Generally, housing in Columbia is 20.0% less expensive than the national average, with rent falling between $1,082 - $1,493. You can expect to pay 3.1% less for groceries, 6.0% less for utilities, and 10.4% less for transportation.
Explore how walkable, bikeable, drivable, and transit-friendly Columbia, MO is for everyday living.
Car-Dependent
This area is considered a car-dependent area and most errands will require a car.
Somewhat Bikeable
You might be able to find places to ride your bike in this area, but you’ll most likely want your car for most errands.
Public
Grades PK-5

Public
Grades K-5
Public
Grades PK-5
Public
Grades PK-5

Public
Grades PK-5
Public
Grades 6-8
Public
Grades 6-8

Public
Grades 6-8

Public
Grades 6-8
Public
Grades 6-8
Rock Bridge Senior High School
Public
Grades 9-12
Public
Grades PK & 9-12
Public
Grades PK & 9-12

Public
Grades PK-12

Public
Grades K-12


14
Communities
848
Units
4
Cities

100
Communities
10,613
Units
67
Cities

34
Communities
9,777
Units
12
Cities

30
Communities
7,984
Units
23
Cities

159
Communities
26,767
Units
111
Cities

27
Communities
1,646
Units
24
Cities
† Our analysis of utilities, groceries, transportation, healthcare, home prices, and other goods and services is sourced from the Cost of Living Index, a respected benchmark published by the Council for Community and Economic Research (C2ER) that provides a thorough overview of living expenses across different regions.
Rent data is provided by CoStar Group’s Market Trend reports. As the industry leader in commercial real estate information, analytics, and news, CoStar conducts extensive research to produce and maintain a comprehensive database of commercial real estate information. We combine this data with public record to provide the most up-to-date rental information available.
Consumer goods, services, and home prices are sourced from the Cost of Living Index published by the Council for Community and Economic Research (C2ER). The data on this page is updated quarterly. It was last published in February 2026.


