
Median Age
38 Years
Largest Age Group
30-39 Years
Approximately 16% of Residents
Under 20
23%
Over 65
19%


Avg Rent
$1,277
Population
192,427
Renter Mix
50% Rent
Chattanooga sits where the Tennessee River curves against the base of Lookout Mountain, giving the city a distinct sense of place that few mid-sized cities can match. With roughly 181,000 residents, it is Tennessee's fourth-largest city and a growing economic center anchored by advanced manufacturing, healthcare, insurance, and a Volkswagen assembly plant at Enterprise South that draws suppliers and corporate offices to the region. The University of Tennessee at Chattanooga adds an academic presence near the heart of the city, supporting a medical corridor that has become one of the more active employment hubs in the Southeast.
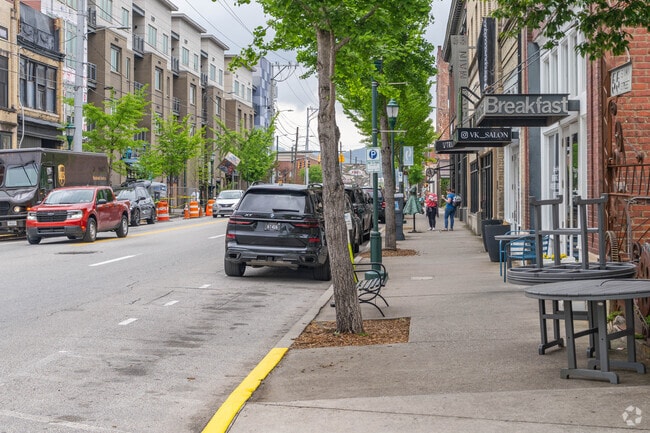
Neighborhoods range widely in character. Downtown and the adjacent Southside offer lofts, converted warehouses, and newer high-rise apartment communities close to the Tennessee Aquarium and Warehouse Row. North Shore, just across the Walnut Street Bridge, provides a quieter residential feel with access to Coolidge Park and the riverfront. St. Elmo holds historic streets at the foot of Lookout Mountain, while Highland Park offers renovated homes and apartments near Sculpture Fields. Renters can choose from restored bungalows, modern mid-rises, and large apartment communities spread across these distinct districts, with commute times across most of the city staying well under half an hour.
The pedestrian bridge is one of the main features of the Northshore.
The Chattanooga Aquarium makes for a great activity for families in Brainerd Hills.
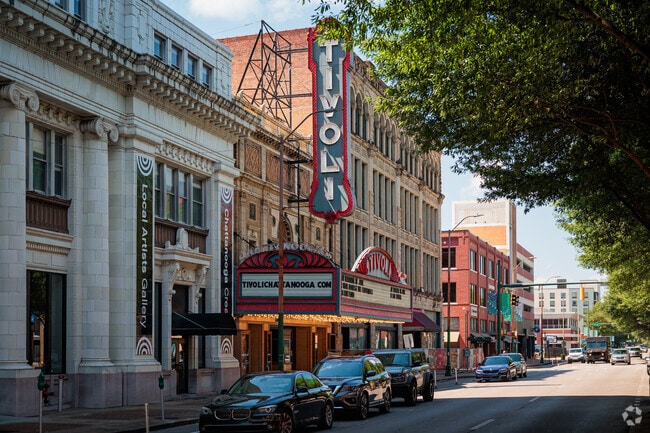
The Tivoli is a City Center staple for stage performances and events.
Suburbs of Chattanooga offer space and quiet.
Townhomes are a popular housing option in Chattanooga.
The Riverpark Middle Street Trailhead doubles as a bicycle station for Alton Park.
Median Household Income
$55,796
Average: $78,911
Education
55,565
Residents Have a Degree
Job Market
95,057
Workers Employed
Median Age
38 Years
Largest Age Group
30-39 Years
Approximately 16% of Residents
Under 20
23%
Over 65
19%
Housing Distribution
In Chattanooga, there are roughly the same number of renters and homeowners.

Education Distribution
Review this city's overall education levels.

As of July 2026, the average apartment rent in Chattanooga, TN is $1,082 for a studio, $1,278 for one bedroom, $1,498 for two bedrooms, and $1,800 for three bedrooms. Apartment rent in Chattanooga has increased by 2.8% in the past year.
The cost of living in Chattanooga, TN is 12.7% lower than the national average. Generally, housing in Chattanooga is 23.3% less expensive than the national average, with rent falling between $1,083 - $1,799. You can expect to pay 3.2% less for groceries, 11.3% less for utilities, and 11.4% less for transportation.
Compare Cities
Explore how walkable, bikeable, drivable, and transit-friendly Chattanooga, TN is for everyday living.
Somewhat Walkable
Walkability
Limited Public Transit
Transit
Exceptionally Drivable
Drivability
Not Bikeable
Bikeability
Public
Grades K-5
457 Students

Public
Grades PK-5
417 Students
Chattanooga School For The Liberal Arts
Public
Grades K-12
792 Students

Normal Park Museum Magnet School
Public
Grades PK-8
820 Students

Public
Grades PK-5
610 Students
Chatt High Center For Creative Arts
Public
Grades 6-12
649 Students
Chattanooga School For The Liberal Arts
Public
Grades K-12
792 Students
Chattanooga School for Arts and Sciences Csas Uppe
Public
Grades 6-12
741 Students
Normal Park Museum Magnet School
Public
Grades PK-8
820 Students
Public
Grades 6-8
550 Students
Chattanooga State Mid College High School
Public
Grades 9-12
131 Students

Chatt High Center For Creative Arts
Public
Grades 6-12
649 Students
Public
Grades 9-12
279 Students
Chattanooga School For The Liberal Arts
Public
Grades K-12
792 Students
Chattanooga School for Arts and Sciences Csas Uppe
Public
Grades 6-12
741 Students
† Our analysis of utilities, groceries, transportation, healthcare, home prices, and other goods and services is sourced from the Cost of Living Index, a respected benchmark published by the Council for Community and Economic Research (C2ER) that provides a thorough overview of living expenses across different regions.
Rent data is provided by CoStar Group’s Market Trend reports. As the industry leader in commercial real estate information, analytics, and news, CoStar conducts extensive research to produce and maintain a comprehensive database of commercial real estate information. We combine this data with public record to provide the most up-to-date rental information available.
Consumer goods, services, and home prices are sourced from the Cost of Living Index published by the Council for Community and Economic Research (C2ER). The data on this page is updated quarterly. It was last published in June 2026.
Demographic information comes from Neustar and combines detailed address data with U.S. Census and American Community Survey statistics to produce reliable local estimates.


