
Altoview Apartment Homes
310 Fisher St,
Charlottesville, VA 22911
$1,700 - $2,942 Total Monthly Price
1-3 Beds

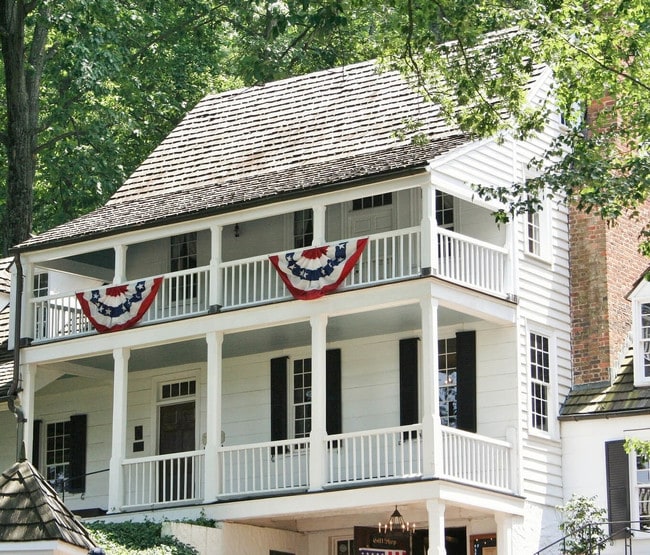

Located in central Virginia, Charlottesville combines historical significance with contemporary appeal. As home to the University of Virginia, established by Thomas Jefferson, the city centers around the Downtown Mall, an eight-block outdoor pedestrian area lined with shops and restaurants. The rental market offers diverse options, with average rents ranging from $1,182 for studios to $2,548 for four-bedroom homes, reflecting a 4.5% year-over-year increase. Notable areas include the Rugby Road neighborhood near UVA's Grounds, the West Main Street area, and Belmont, each featuring a selection of newer apartment communities and restored historic properties.
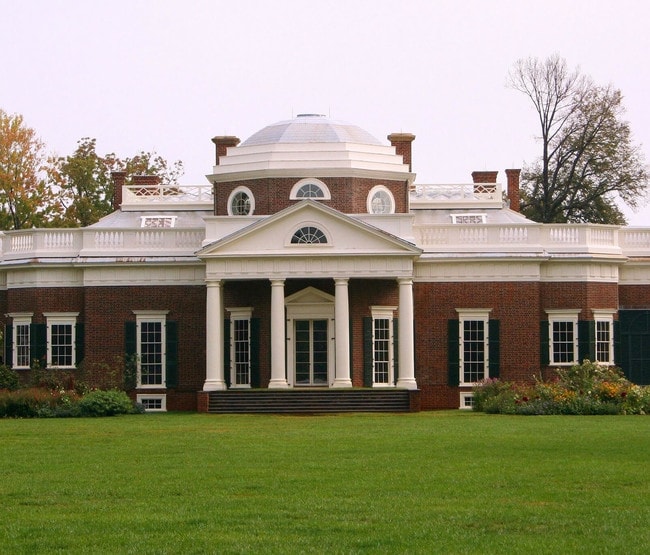
The city showcases its heritage through Monticello and the University's Rotunda, both designated UNESCO World Heritage sites. Outdoor enthusiasts appreciate access to Shenandoah National Park and local green spaces like McIntire Park and Riverview Park. Throughout the year, residents enjoy cultural events at the Jefferson Theater and John Paul Jones Arena, along with annual celebrations including the Virginia Film Festival. With convenient access to local farmers' markets and an established arts scene, Charlottesville offers a comfortable living environment that honors its past while embracing contemporary conveniences.
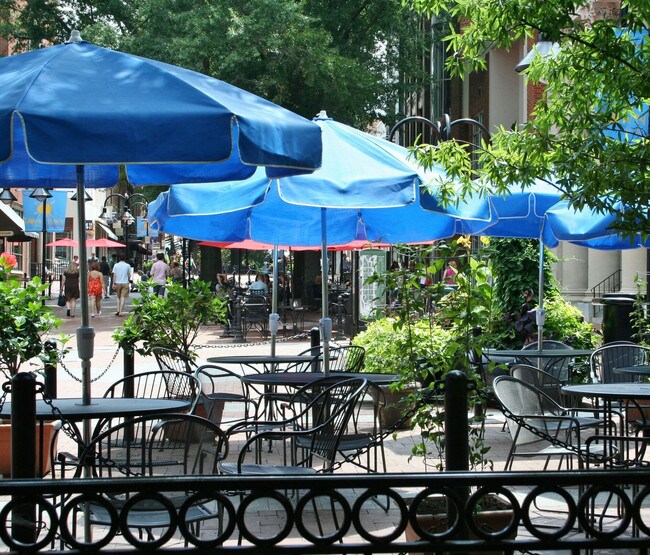
An open-air cafe in Charlottesville
Monticello was designed by Thomas Jefferson
Hiking trail at Monticello
As of March 2026, the average apartment rent in Charlottesville, VA is $1,289 for a studio, $1,721 for one bedroom, $1,964 for two bedrooms, and $2,246 for three bedrooms. Apartment rent in Charlottesville has decreased by -0.1% in the past year.
The cost of living in Charlottesville, VA is 0.9% lower than the national average. Generally, housing in Charlottesville is 1.5% more expensive than the national average, with rent falling between $1,289 - $2,246. You can expect to pay 1.7% less for groceries, 0.6% more for utilities, and 5.6% less for transportation.
Explore how walkable, bikeable, drivable, and transit-friendly Charlottesville, VA is for everyday living.
Somewhat Walkable
You might be able to get out and walk when living in this area. Some errands can be accomplished on foot, but for others you’ll need a car.
Minimal Transit
You'll likely want a car when living in this area since it has few transit options.
Bikeable
While there’s some bike infrastructure in this area, you’ll still need a car for many errands.
Public
Grades PK-5

Public
Grades K-5
Public
Grades PK-5

Public
Grades PK-5
Public
Grades PK-5

Public
Grades 6-12

Public
Grades 6-8
Public
Grades 6-8

Public
Grades 6-8
Public
Grades 6-8
Public
Grades 6-12
Public
Grades 9-12
Public
Grades 9-12
Public
Grades 9-12

Charlottesville-Albemarle Tech
Public
Grades K-12


21
Communities
2,878
Units
17
Cities

14
Communities
3,555
Units
9
Cities

3,487
Communities
959,069
Units
894
Cities

102
Communities
20,410
Units
42
Cities

23
Communities
5,230
Units
13
Cities

52
Communities
10,873
Units
39
Cities
† Our analysis of utilities, groceries, transportation, healthcare, home prices, and other goods and services is sourced from the Cost of Living Index, a respected benchmark published by the Council for Community and Economic Research (C2ER) that provides a thorough overview of living expenses across different regions.
Rent data is provided by CoStar Group’s Market Trend reports. As the industry leader in commercial real estate information, analytics, and news, CoStar conducts extensive research to produce and maintain a comprehensive database of commercial real estate information. We combine this data with public record to provide the most up-to-date rental information available.
Consumer goods, services, and home prices are sourced from the Cost of Living Index published by the Council for Community and Economic Research (C2ER). The data on this page is updated quarterly. It was last published in February 2026.


