Median Age
37 Years
Largest Age Group
30-39 Years
Approximately 15% of Residents
Under 20
26%
Over 65
14%


Avg Rent
$1,733
Population
147,091
Renter Mix
62% Rent
Bridgeport combines waterfront living along Long Island Sound with city convenience. The city's rental market shows moderate growth, with average rents ranging from $1,349 for studios to $1,954 for three-bedroom units, and year-over-year increases between 0.7% and 4.7%. True to its nickname "The Park City," Bridgeport features the 375-acre Seaside Park, designed by Frederick Law Olmsted, and the 100-acre Beardsley Park. Downtown Bridgeport showcases preserved historic architecture alongside newer developments, while established neighborhoods like Black Rock and the North End offer housing options from classic Victorian homes to contemporary apartments. The University of Bridgeport and Housatonic Community College contribute to the city's educational landscape.
Connecticut's largest city offers numerous entertainment options, including performances at the Hartford HealthCare Amphitheater and the Klein Memorial Auditorium. Local attractions include the Barnum Museum, which chronicles P.T. Barnum's history, and the Beardsley Zoo. Throughout Bridgeport's neighborhoods, you'll find restaurants serving Brazilian, Vietnamese, and Italian cuisine. Transportation options include Metro-North and Amtrak rail services for easy access to New York City, while the Bridgeport & Port Jefferson Ferry connects to Long Island. The rental market remains stable, with studio apartments showing the highest year-over-year increase at 4.7%, offering more affordable options compared to New York City while maintaining access to both urban and coastal amenities.
Pleasure Beach Park is a quiet place to relax by the water.
Captain’s Cove Seaport in West End, Bridgeport, is a summer favorite for seafood.
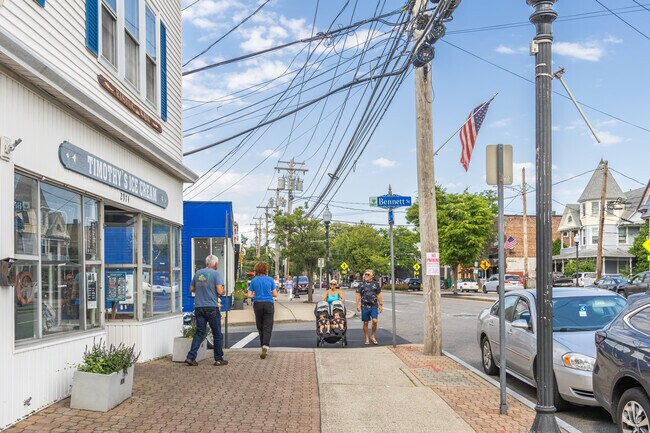
Enjoy a variety of dining options on Fairfield Avenue in Black Rock, Bridgeport.
Discover the rich history and vibrant community in West End-West Side, Bridgeport.
Downtown Bridgeport also features creative art installations like the Broad Street steps.
Downtown Bridgeport’s skyline includes historic churches and high-rises.
Median Household Income
$48,368
Average: $69,333
Education
27,692
Residents Have a Degree
Job Market
72,381
Workers Employed
Median Age
37 Years
Largest Age Group
30-39 Years
Approximately 15% of Residents
Under 20
26%
Over 65
14%
Housing Distribution
Bridgeport has more renters than homeowners.

Education Distribution
Review this city's overall education levels.

As of July 2026, the average apartment rent in Bridgeport, CT is $1,421 for a studio, $1,733 for one bedroom, $2,010 for two bedrooms, and $2,186 for three bedrooms. Apartment rent in Bridgeport has increased by 1.7% in the past year.
Explore how walkable, bikeable, drivable, and transit-friendly Bridgeport, CT is for everyday living.
Moderately Walkable
Walkability
Some Public Transit
Transit
Very Drivable
Drivability
Fairly Bikeable
Bikeability
Public
Grades K-8
396 Students

Public
Grades K-8
434 Students

Public
Grades PK-8
607 Students

Six to Six Interdistrict Magnet School
Public
Grades PK-8
441 Students
Public
Grades PK-8
1,068 Students

Public
Grades K-8
396 Students
Public
Grades K-8
434 Students
Public
Grades PK-8
607 Students
Six to Six Interdistrict Magnet School
Public
Grades PK-8
441 Students
Public
Grades 6-12
281 Students
Biotechnology Research And Zoological Studies High At The Fa
Public
Grades 9-12
392 Students
Information Technology And Software Engineering High School
Public
Grades 9-12
392 Students
Aerospace/Hydrospace Engineering And Physical Sciences High School
Public
Grades 9-12
307 Students
Public
Grades 6-12
281 Students
Bullard-Havens Technical High School
Public
Grades 9-12
810 Students
† Our analysis of utilities, groceries, transportation, healthcare, home prices, and other goods and services is sourced from the Cost of Living Index, a respected benchmark published by the Council for Community and Economic Research (C2ER) that provides a thorough overview of living expenses across different regions.
Rent data is provided by CoStar Group’s Market Trend reports. As the industry leader in commercial real estate information, analytics, and news, CoStar conducts extensive research to produce and maintain a comprehensive database of commercial real estate information. We combine this data with public record to provide the most up-to-date rental information available.
Consumer goods, services, and home prices are sourced from the Cost of Living Index published by the Council for Community and Economic Research (C2ER). The data on this page is updated quarterly. It was last published in June 2026.
Demographic information comes from Neustar and combines detailed address data with U.S. Census and American Community Survey statistics to produce reliable local estimates.


