Median Age
31 Years
Largest Age Group
20-29 Years
Approximately 22% of Residents
Under 20
26%
Over 65
12%


Avg Rent
$894
Population
70,625
Renter Mix
62% Rent
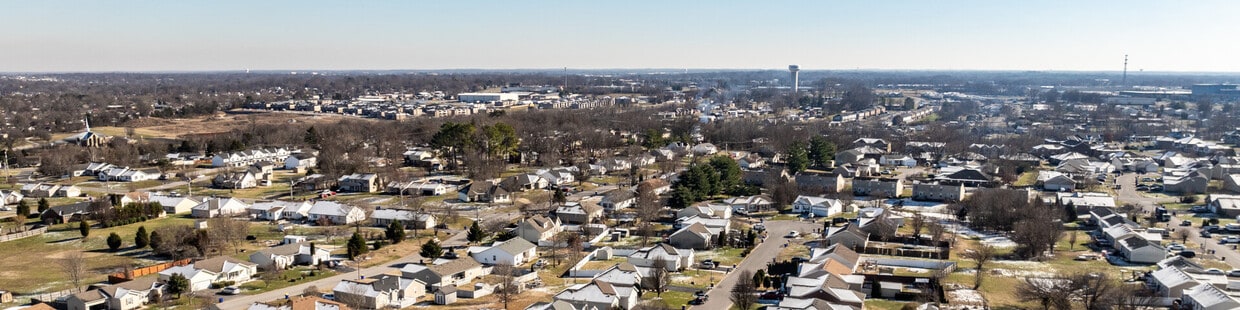
Located in south-central Kentucky, Bowling Green combines historic architecture with contemporary living. As home to Western Kentucky University, the city maintains a strong educational presence while preserving its small-town community spirit. The heart of downtown centers around Fountain Square Park, which hosts community events throughout the seasons. Outdoor recreation opportunities abound at Lost River Cave, featuring Kentucky's only underground boat tour, while Weldon Peete Park offers dedicated mountain biking trails and climbing areas. The city's automotive heritage shines through the National Corvette Museum and the GM Corvette Assembly Plant, drawing visitors from across the globe.
The rental market in Bowling Green offers various housing options, with average monthly rents ranging from $671 for studios to $1,497 for four-bedroom homes. The Downtown district features preserved historic architecture, while areas near Western Kentucky University and Greenwood showcase a mix of housing styles. Notable historic areas include the St. Joseph Historic District and Shake Rag Historic District, both listed on the National Register of Historic Places. As Kentucky's third-largest city with over 72,000 residents, Bowling Green maintains lower living costs compared to similar-sized cities.
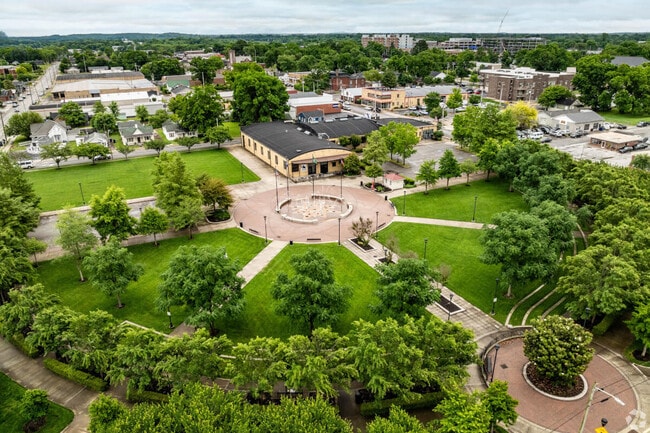
An aerial view of Circus Square Park in Downtown Bowling Green.
Fountain Square Park in Downtown Bowling Green has a historic fountain.
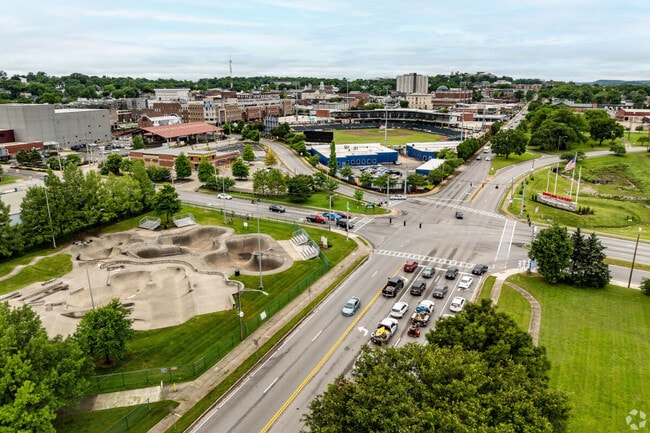
An aerial view of Downtown Bowling Green shows an outdoor skate park and lush trees.
Median Household Income
$43,659
Average: $64,132
Education
18,579
Residents Have a Degree
Job Market
35,254
Workers Employed
Median Age
31 Years
Largest Age Group
20-29 Years
Approximately 22% of Residents
Under 20
26%
Over 65
12%
Housing Distribution
Bowling Green has more renters than homeowners.

Education Distribution
Review this city's overall education levels.

As of July 2026, the average apartment rent in Bowling Green, KY is $637 for a studio, $894 for one bedroom, $1,113 for two bedrooms, and $1,535 for three bedrooms. Apartment rent in Bowling Green has decreased by -0.2% in the past year.
The cost of living in Bowling Green, KY is 11.1% lower than the national average. Generally, housing in Bowling Green is 28.5% less expensive than the national average, with rent falling between $637 - $1,535. You can expect to pay 5.4% less for groceries, 9.6% more for utilities, and 9.2% less for transportation.
Compare Cities
Explore how walkable, bikeable, drivable, and transit-friendly Bowling Green, KY is for everyday living.
Fairly Walkable
Walkability
Very Drivable
Drivability
Fairly Bikeable
Bikeability
Public
Grades PK-5
993 Students

Public
Grades PK-5
764 Students

Public
Grades PK-5
682 Students
Public
Grades K-5
499 Students
Public
Grades K-5
426 Students
Public
Grades 6-8
703 Students

Public
Grades 6-8
815 Students
Bowling Green Junior High School
Public
Grades 6-8
1,027 Students

Public
Grades 6-8
963 Students
Public
Grades 6-12
155 Students

Public
Grades 9-12
1,409 Students
Public
Grades 9-12
1,474 Students
Public
Grades 9-12
1,369 Students
Public
Grades 6-12
155 Students
Public
Grades 9-12
930 Students

† Our analysis of utilities, groceries, transportation, healthcare, home prices, and other goods and services is sourced from the Cost of Living Index, a respected benchmark published by the Council for Community and Economic Research (C2ER) that provides a thorough overview of living expenses across different regions.
Rent data is provided by CoStar Group’s Market Trend reports. As the industry leader in commercial real estate information, analytics, and news, CoStar conducts extensive research to produce and maintain a comprehensive database of commercial real estate information. We combine this data with public record to provide the most up-to-date rental information available.
Consumer goods, services, and home prices are sourced from the Cost of Living Index published by the Council for Community and Economic Research (C2ER). The data on this page is updated quarterly. It was last published in June 2026.
Demographic information comes from Neustar and combines detailed address data with U.S. Census and American Community Survey statistics to produce reliable local estimates.


