Median Age
39 Years
Largest Age Group
25-34 Years
Approximately 14% of Residents
Under 20
24%
Over 65
20%

Avg Rent
$1,272
Population
129,853
Renter Mix
38% Rent
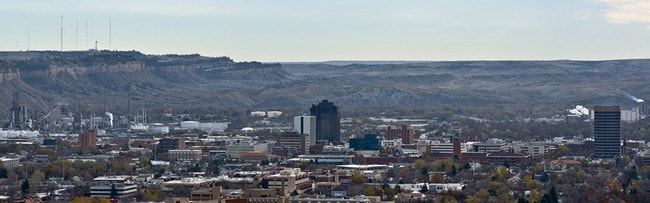
Surrounded by dramatic rimrock cliffs in the Yellowstone Valley, Billings combines city living with outdoor adventure. As Montana's largest city, it serves as the region's economic and medical center. The rental market remains steady, with one-bedroom apartments averaging $1,278, reflecting a 5% annual increase. The Heights neighborhood continues to expand with new residential developments, while downtown features converted loft apartments above local businesses. The South Hills and West End neighborhoods offer apartment communities and residential options.
Montana State University Billings and Rocky Mountain College contribute to the city's educational landscape, while the medical corridor includes St. Vincent Healthcare and Billings Clinic. The 30-mile trail system connects neighborhoods throughout the city, with the Beartooth Mountains visible on the horizon. Downtown's brewery district includes established venues like Uberbrew and Thirsty Street Brewing. Local landmarks include ZooMontana, the Yellowstone Art Museum, and the recently renovated Alberta Bair Theater. The restored Billings Depot showcases the city's railroad heritage, while MontanaFair brings regional celebrations to MetraPark each August.
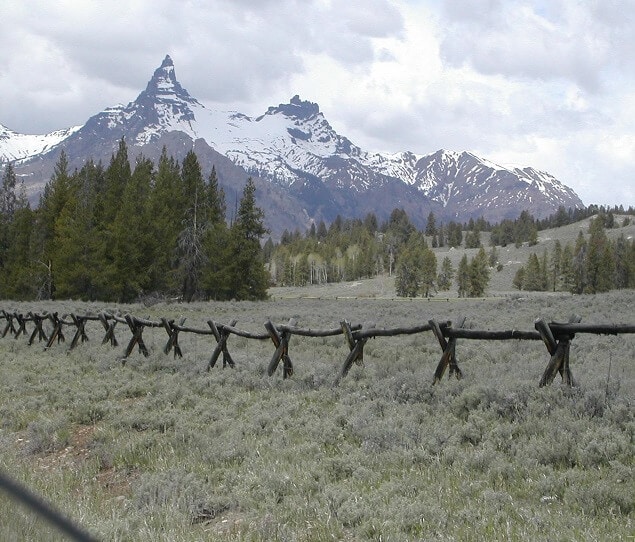
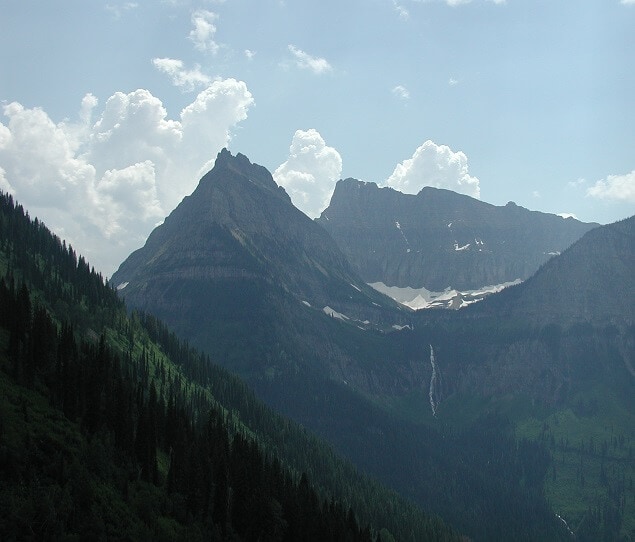
Beartooth Mountains near Billings
Enjoy the rugged landscape of Montana
Median Household Income
$69,842
Average: $87,463
Education
39,501
Residents Have a Degree
Job Market
66,835
Workers Employed
Median Age
39 Years
Largest Age Group
25-34 Years
Approximately 14% of Residents
Under 20
24%
Over 65
20%
Housing Distribution
Billings has more homeowners than renters.

Education Distribution
Review this city's overall education levels.

As of July 2026, the average apartment rent in Billings, MT is $1,064 for a studio, $1,271 for one bedroom, $1,492 for two bedrooms, and $2,071 for three bedrooms. Apartment rent in Billings has decreased by -0.9% in the past year.
The cost of living in Billings, MT is 3.1% lower than the national average. Generally, housing in Billings is 8.2% less expensive than the national average, with rent falling between $1,063 - $2,072. You can expect to pay 3.3% more for groceries, 18.3% less for utilities, and 5.2% more for transportation.
Compare Cities
Explore how walkable, bikeable, drivable, and transit-friendly Billings, MT is for everyday living.
Moderately Walkable
Walkability
Moderately Drivable
Drivability
Fairly Bikeable
Bikeability
Public
Grades PK-5
285 Students

Public
Grades PK-5
691 Students

Public
Grades PK-5
434 Students

Alkali Creek Elementary School
Public
Grades PK-5
310 Students
Public
Grades PK-5
188 Students
Public
Grades 6-8
46 Students

Public
Grades 6-8
144 Students
Public
Grades 6-8
517 Students

Public
Grades 6-8
740 Students

Public
Grades 6-8
634 Students
Public
Grades 9-12
2,115 Students
Public
Grades 9-12
1,739 Students

Public
Grades 9-12
1,629 Students
Public
Grades 9-12
1,602 Students
† Our analysis of utilities, groceries, transportation, healthcare, home prices, and other goods and services is sourced from the Cost of Living Index, a respected benchmark published by the Council for Community and Economic Research (C2ER) that provides a thorough overview of living expenses across different regions.
Rent data is provided by CoStar Group’s Market Trend reports. As the industry leader in commercial real estate information, analytics, and news, CoStar conducts extensive research to produce and maintain a comprehensive database of commercial real estate information. We combine this data with public record to provide the most up-to-date rental information available.
Consumer goods, services, and home prices are sourced from the Cost of Living Index published by the Council for Community and Economic Research (C2ER). The data on this page is updated quarterly. It was last published in June 2026.
Demographic information comes from Neustar and combines detailed address data with U.S. Census and American Community Survey statistics to produce reliable local estimates.


