
Inter Pointe
501 S 44th St W,
Billings, MT 59106
$1,050 - $2,200
Studio - 3 Beds

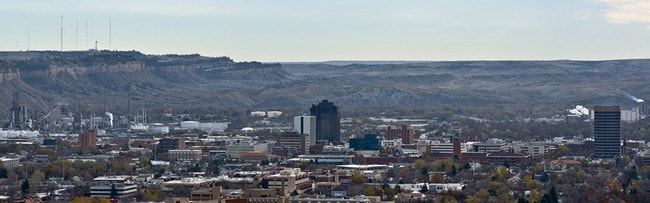
Surrounded by dramatic rimrock cliffs in the Yellowstone Valley, Billings combines city living with outdoor adventure. As Montana's largest city, it serves as the region's economic and medical center. The rental market remains steady, with one-bedroom apartments averaging $1,278, reflecting a 5% annual increase. The Heights neighborhood continues to expand with new residential developments, while downtown features converted loft apartments above local businesses. The South Hills and West End neighborhoods offer apartment communities and residential options.
Montana State University Billings and Rocky Mountain College contribute to the city's educational landscape, while the medical corridor includes St. Vincent Healthcare and Billings Clinic. The 30-mile trail system connects neighborhoods throughout the city, with the Beartooth Mountains visible on the horizon. Downtown's brewery district includes established venues like Uberbrew and Thirsty Street Brewing. Local landmarks include ZooMontana, the Yellowstone Art Museum, and the recently renovated Alberta Bair Theater. The restored Billings Depot showcases the city's railroad heritage, while MontanaFair brings regional celebrations to MetraPark each August.
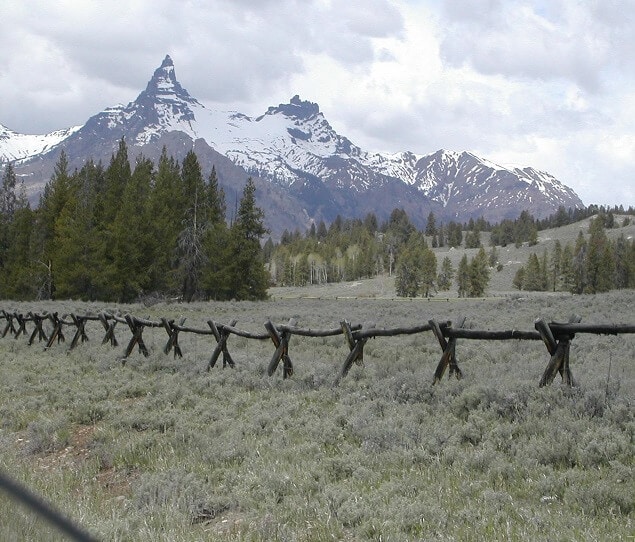
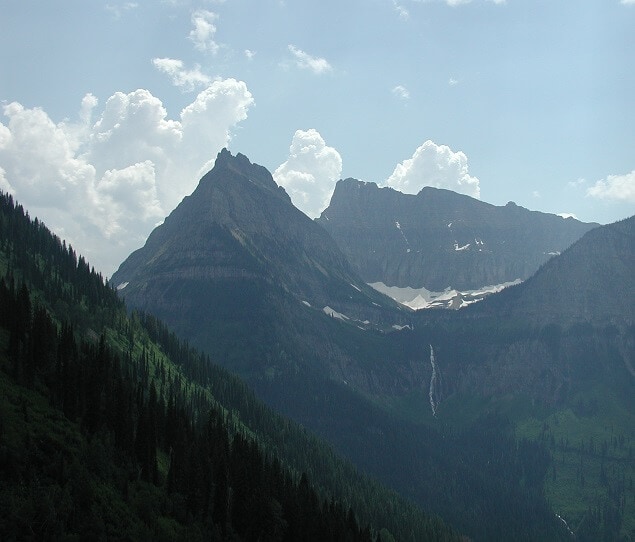
Beartooth Mountains near Billings
Enjoy the rugged landscape of Montana
As of March 2026, the average apartment rent in Billings, MT is $1,078 for a studio, $1,270 for one bedroom, $1,505 for two bedrooms, and $2,038 for three bedrooms. Apartment rent in Billings has increased by 2.4% in the past year.
The cost of living in Billings, MT is 3.0% lower than the national average. Generally, housing in Billings is 7.2% less expensive than the national average, with rent falling between $1,078 - $2,038. You can expect to pay 3.2% more for groceries, 18.4% less for utilities, and 4.8% more for transportation.
Explore how walkable, bikeable, drivable, and transit-friendly Billings, MT is for everyday living.
Car-Dependent
This area is considered a car-dependent area and most errands will require a car.
Somewhat Bikeable
You might be able to find places to ride your bike in this area, but you’ll most likely want your car for most errands.
Public
Grades PK-5

Public
Grades PK-5

Public
Grades PK-5

Public
Grades PK-5
Public
Grades PK-5

Public
Grades 6-8

Public
Grades 6-8
Public
Grades 6-8
Public
Grades 6-8

Public
Grades 6-8
Public
Grades 9-12
Public
Grades 9-12

Public
Grades 9-12
46
Communities
9,556
Units
25
Cities
21
Communities
2,593
Units
9
Cities

34
Communities
10,418
Units
5
Cities

36
Communities
7,069
Units
15
Cities
12
Communities
1,348
Units
7
Cities

36
Communities
5,820
Units
33
Cities
† Our analysis of utilities, groceries, transportation, healthcare, home prices, and other goods and services is sourced from the Cost of Living Index, a respected benchmark published by the Council for Community and Economic Research (C2ER) that provides a thorough overview of living expenses across different regions.
Rent data is provided by CoStar Group’s Market Trend reports. As the industry leader in commercial real estate information, analytics, and news, CoStar conducts extensive research to produce and maintain a comprehensive database of commercial real estate information. We combine this data with public record to provide the most up-to-date rental information available.
Consumer goods, services, and home prices are sourced from the Cost of Living Index published by the Council for Community and Economic Research (C2ER). The data on this page is updated quarterly. It was last published in February 2026.


