Median Age
33 Years
Largest Age Group
10-19 Years
Approximately 16% of Residents
Under 20
30%
Over 65
13%
Avg Rent
$1,307
Population
402,171
Renter Mix
41% Rent
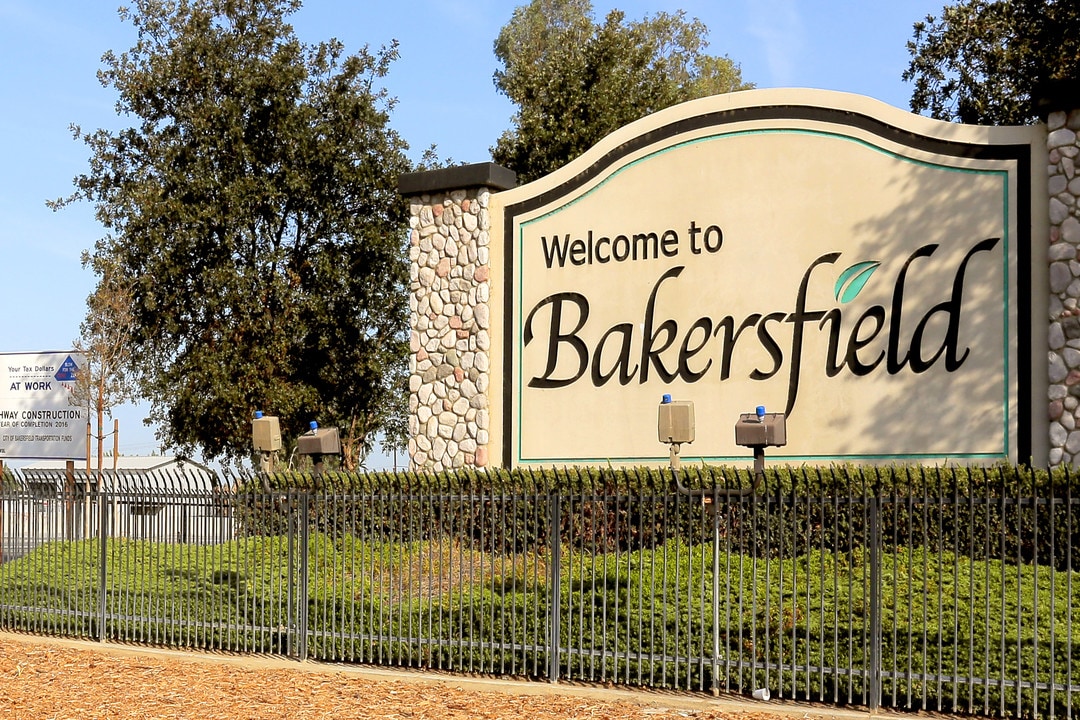
Positioned right where the San Joaquin Valley meets the Sierra Nevada, Bakersfield is a thriving community that wears its unique heritage on its sleeve. While one of California’s largest cities today, Bakersfield’s local character is heavily influenced by its agricultural background. Horse shows are popular, with many filling the calendar, and locals love to take advantage of the outlying landscape in off-road vehicles. Festivals throughout the year celebrate the city’s diverse cultural influences, including Native American, Basque, Greek, and Scottish events.
Musical traditions run deep in Bakersfield, and largely define the community. The city is nicknamed “Nashville West” for its tremendous output of country music over the years, with legendary hometown performers like Merle Haggard and Buck Owens popularizing the “Bakersfield Sound” from the 1960s forward and influencing generations of musicians in the process; today, the bars and venues of Downtown Bakersfield play host to musicians of all genres, continuing the city’s proud legacy.
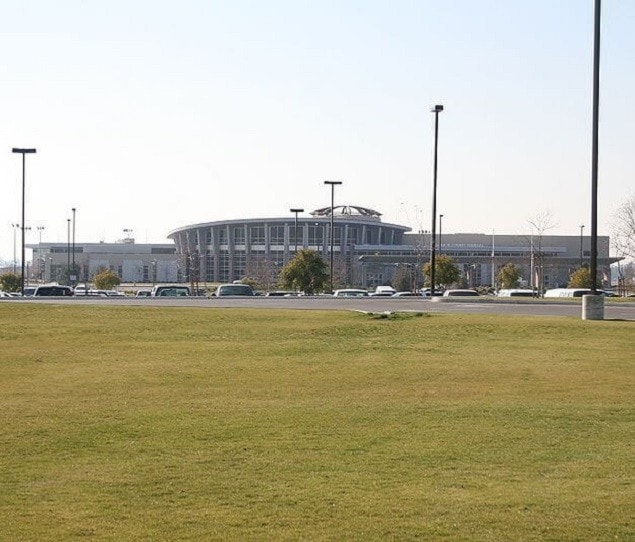
Meadows Field Airport is just three miles from downtown
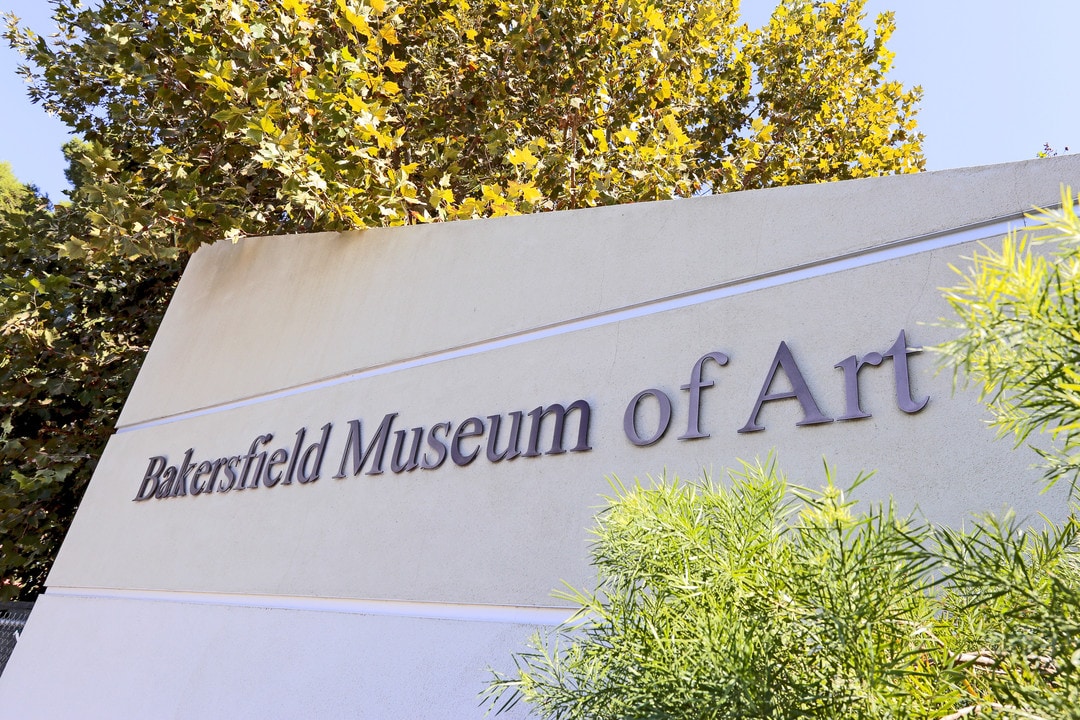
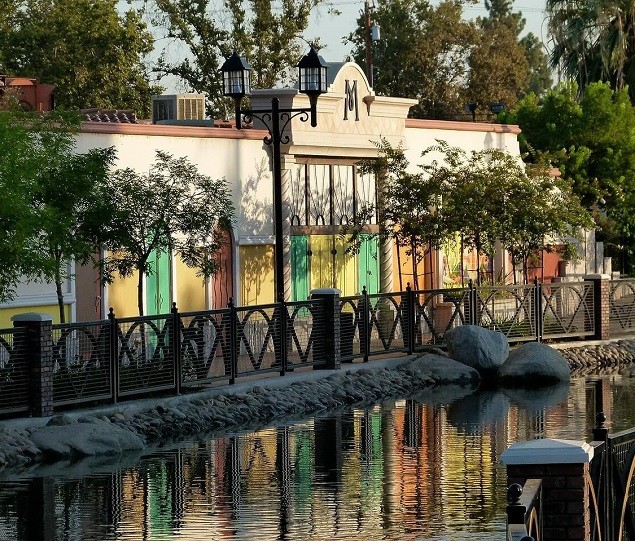
Central Park at Mill Creek is home to the Bakersfield Museum of Art
Median Household Income
$71,292
Average: $93,920
Education
74,378
Residents Have a Degree
Job Market
178,485
Workers Employed
Median Age
33 Years
Largest Age Group
10-19 Years
Approximately 16% of Residents
Under 20
30%
Over 65
13%
Housing Distribution
Bakersfield has more homeowners than renters.

Education Distribution
Review this city's overall education levels.

As of July 2026, the average apartment rent in Bakersfield, CA is $954 for a studio, $1,306 for one bedroom, $1,516 for two bedrooms, and $1,895 for three bedrooms. Apartment rent in Bakersfield has increased by 2.1% in the past year.
The cost of living in Bakersfield, CA is 9.6% higher than the national average. Generally, housing in Bakersfield is 4.1% less expensive than the national average, with rent falling between $956 - $1,903. You can expect to pay 4.8% more for groceries, 73.2% more for utilities, and 30.0% more for transportation.
Compare Cities
Explore how walkable, bikeable, drivable, and transit-friendly Bakersfield, CA is for everyday living.
Fairly Walkable
Walkability
Limited Public Transit
Transit
Exceptionally Drivable
Drivability
Somewhat Bikeable
Bikeability
Public
Grades K-5
732 Students

Ronald Reagan Elementary School
Public
Grades K-5
831 Students

Public
Grades K-5
831 Students
Public
Grades K-5
699 Students
W. A. Kendrick Elementary School
Public
Grades K-5
699 Students
Public
Grades 6-8
986 Students

Public
Grades 6-8
986 Students
General Shafter Elementary School
Public
Grades K-8
169 Students
Public
Grades K-8
169 Students
Public
Grades 6-8
1,152 Students

Public
Grades 9-12
2,398 Students
Public
Grades 9-12
2,398 Students
Public
Grades 9-12
2,098 Students
Public
Grades 9-12
2,098 Students
Public
Grades 9-12
2,369 Students
† Our analysis of utilities, groceries, transportation, healthcare, home prices, and other goods and services is sourced from the Cost of Living Index, a respected benchmark published by the Council for Community and Economic Research (C2ER) that provides a thorough overview of living expenses across different regions.
Rent data is provided by CoStar Group’s Market Trend reports. As the industry leader in commercial real estate information, analytics, and news, CoStar conducts extensive research to produce and maintain a comprehensive database of commercial real estate information. We combine this data with public record to provide the most up-to-date rental information available.
Consumer goods, services, and home prices are sourced from the Cost of Living Index published by the Council for Community and Economic Research (C2ER). The data on this page is updated quarterly. It was last published in June 2026.
Demographic information comes from Neustar and combines detailed address data with U.S. Census and American Community Survey statistics to produce reliable local estimates.


