Median Age
42 Years
Largest Age Group
35-44 Years
Approximately 15% of Residents
Under 20
22%
Over 65
20%
Avg Rent
$1,297
Population
8,306
Renter Mix
26% Rent
Audubon, New Jersey sits just outside Philadelphia in Camden County, carrying the kind of small-borough character that larger cities tend to lose over time. Spanning just two square miles, the borough is compact by design but surprisingly full in spirit. It earned the title of Most Patriotic Small Town in America, a distinction rooted in the fact that three Medal of Honor recipients called Audubon home. That legacy shapes a strong sense of local pride that runs through everyday life here.
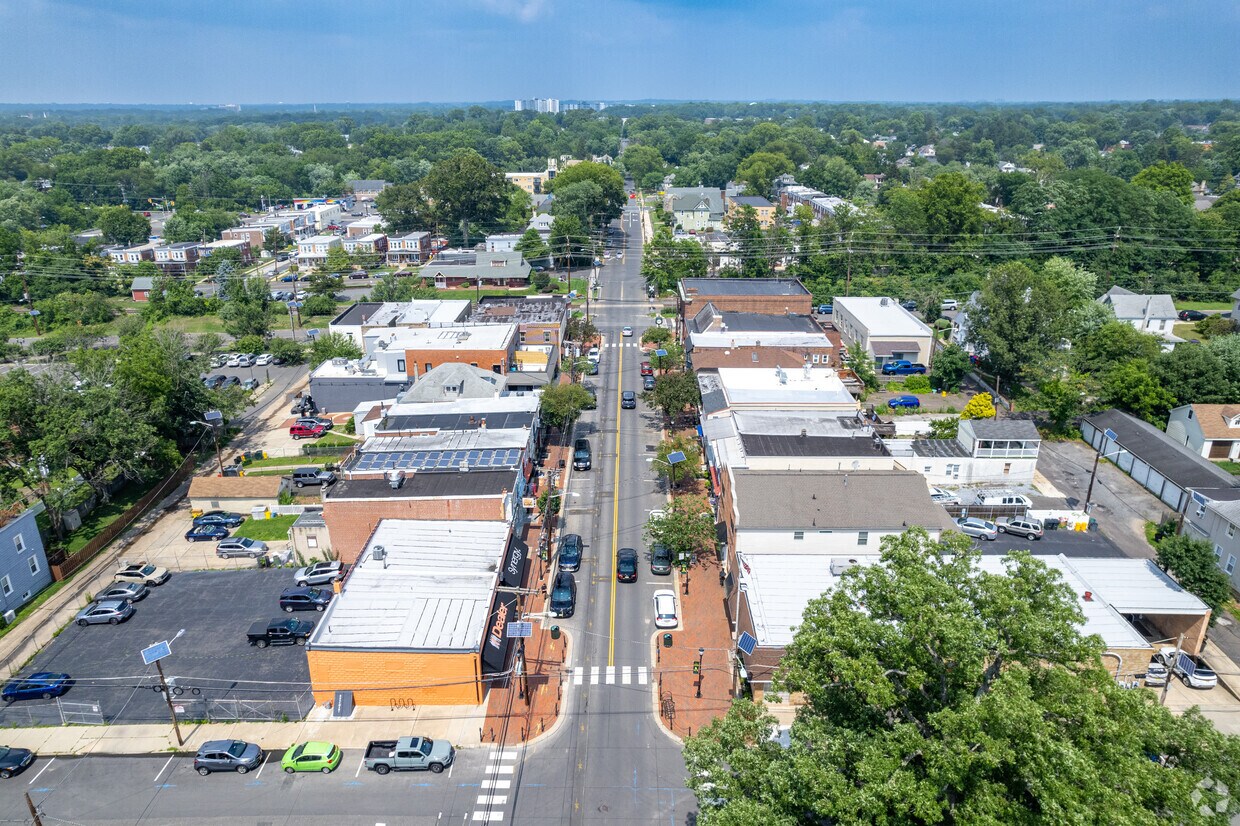
Named after the famed naturalist John James Audubon, the borough draws residents who value a quieter pace without sacrificing access to a major metro. Philadelphia's Center City is less than ten miles away, and nearby Camden adds additional economic and cultural connections to the broader region. The borough's walkable scale and well-established neighborhoods make it an appealing base for those who want proximity to big-city opportunities without the big-city footprint.
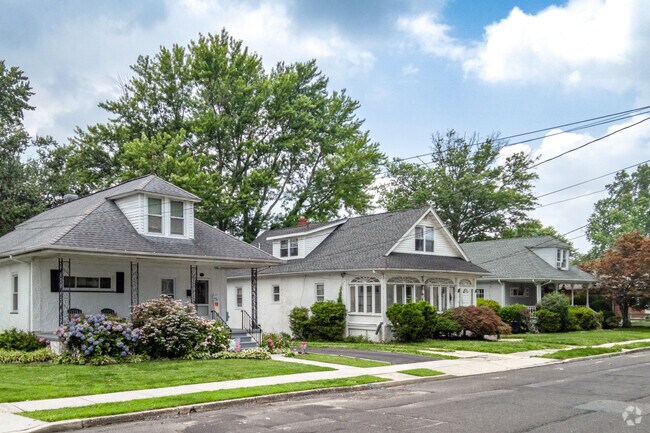
The housing stock in Audubon reflects its close-knit, established character. Renters will find traditional single-family rentals alongside smaller apartment communities that fit the borough's low-rise, residential aesthetic. Options tend toward classic construction with tree-lined surroundings, giving the area a grounded, settled feel that newer developments in larger cities rarely replicate.
Most Audubon homes are generally close together and feature about 2,000 square feet.
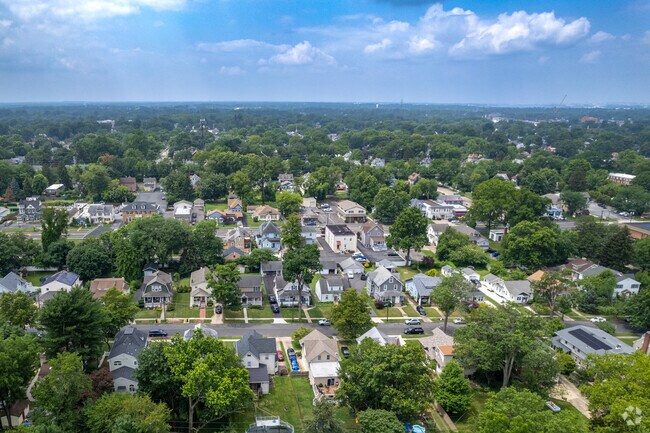
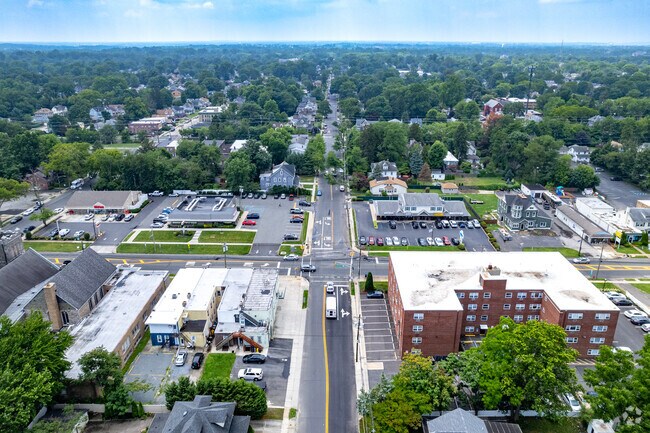
Audubon neighborhood is a peaceful area surrounded by trees and greenery.
View of Audubon neighborhood located in New Jersey.
Enjoy a cup of coffee and breakfast inside or out front at Brown Dog Café.
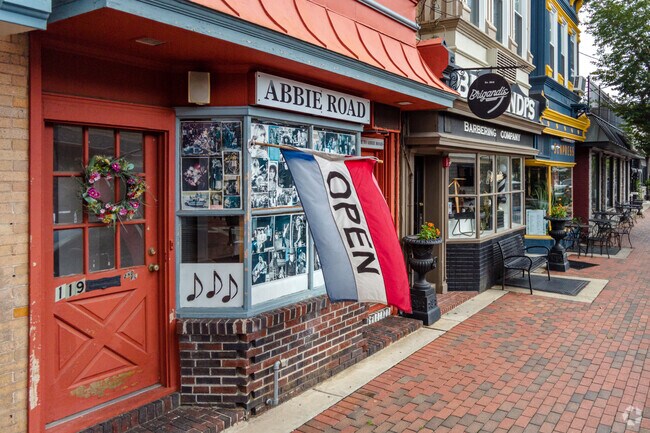
In downtown Audubon you will find local salons and barbers like Splitting Hairs Salon.
Peddlers path on Merchant Street in downtown Audubon.
Median Household Income
$106,039
Average: $123,130
Education
2,906
Residents Have a Degree
Job Market
4,829
Workers Employed
Median Age
42 Years
Largest Age Group
35-44 Years
Approximately 15% of Residents
Under 20
22%
Over 65
20%
Housing Distribution
Audubon has more homeowners than renters.

Education Distribution
Review this city's overall education levels.

As of July 2026, the average apartment rent in Audubon, NJ is $1,174 for a studio, $1,297 for one bedroom, and $1,462 for two bedrooms. Apartment rent in Audubon has increased by 0.3% in the past year.
Explore how walkable, bikeable, drivable, and transit-friendly Audubon, NJ is for everyday living.
Moderately Walkable
Walkability
Limited Public Transit
Transit
Moderately Drivable
Drivability
Fairly Bikeable
Bikeability
Mansion Avenue Elementary School
Public
Grades K-5
331 Students

Haviland Avenue Elementary School
Public
Grades PK-5
227 Students

Public
Grades 6-12
758 Students

Public
Grades 6-12
758 Students
† Our analysis of utilities, groceries, transportation, healthcare, home prices, and other goods and services is sourced from the Cost of Living Index, a respected benchmark published by the Council for Community and Economic Research (C2ER) that provides a thorough overview of living expenses across different regions.
Rent data is provided by CoStar Group’s Market Trend reports. As the industry leader in commercial real estate information, analytics, and news, CoStar conducts extensive research to produce and maintain a comprehensive database of commercial real estate information. We combine this data with public record to provide the most up-to-date rental information available.
Consumer goods, services, and home prices are sourced from the Cost of Living Index published by the Council for Community and Economic Research (C2ER). The data on this page is updated quarterly. It was last published in June 2026.
Demographic information comes from Neustar and combines detailed address data with U.S. Census and American Community Survey statistics to produce reliable local estimates.


