Median Age
37 Years
Largest Age Group
10-19 Years
Approximately 15% of Residents
Under 20
28%
Over 65
16%


Avg Rent
$922
Population
203,967
Renter Mix
41% Rent
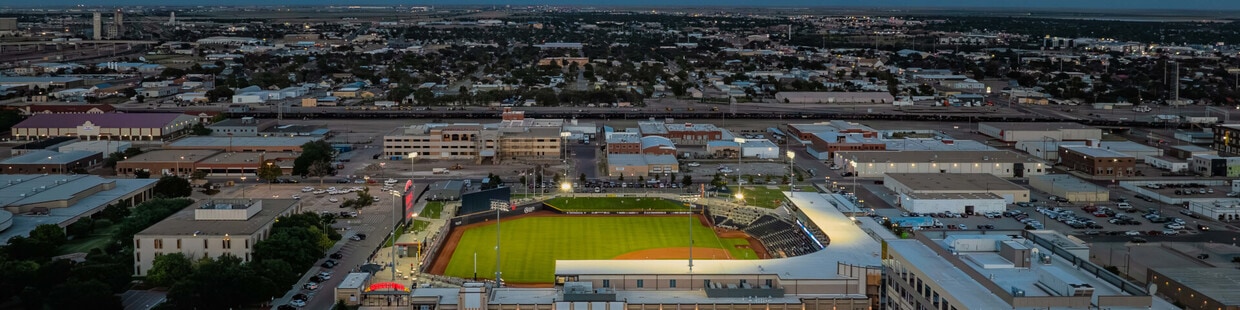
Amarillo welcomes residents with its distinctive Texas character and sweeping views of the Texas Panhandle. Home to over 200,000 residents, the city offers rental options from downtown lofts to suburban apartments with plenty of space. The San Jacinto neighborhood draws renters with its historic architecture and local shops. Rental costs remain moderate, with average rents around $841, and one-bedroom apartments averaging $830 monthly, representing a 1.5% year-over-year increase.
The Route 66 Historic District and Amarillo Cultural District anchor the city's arts scene, featuring performances at the Globe-News Center for the Performing Arts and exhibitions at the Amarillo Museum of Art. Just outside the city, Palo Duro Canyon State Park - the second-largest canyon system in the United States - offers miles of hiking and biking trails. The medical district, centered around the Harrington Regional Medical Center, serves the community's healthcare needs. Amarillo's most photographed landmark, Cadillac Ranch, showcases ten classic Cadillacs buried nose-down in a field. The annual Tri-State Fair & Rodeo, a tradition since 1921, brings together communities from Oklahoma, New Mexico, and Texas each September.
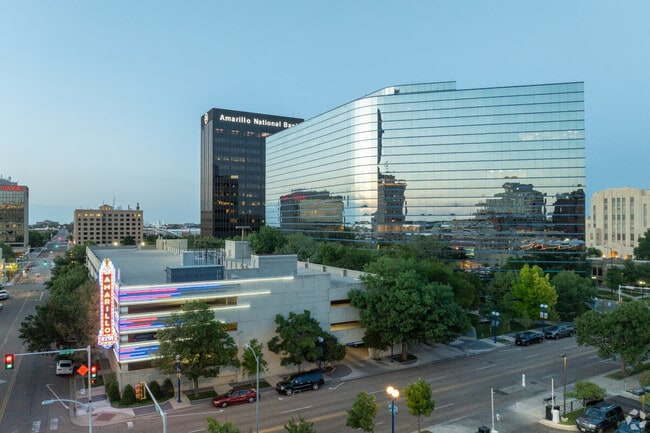
The Amarillo National Bank Neon Sign is a classic landmark.
Palo Duro Canyon stretches out below.
Restaurants in Amarillo serve up delicious Texan fare.
Median Household Income
$56,132
Average: $75,074
Education
41,879
Residents Have a Degree
Job Market
99,131
Workers Employed
Median Age
37 Years
Largest Age Group
10-19 Years
Approximately 15% of Residents
Under 20
28%
Over 65
16%
Housing Distribution
Amarillo has more homeowners than renters.

Education Distribution
Review this city's overall education levels.

As of July 2026, the average apartment rent in Amarillo, TX is $645 for a studio, $923 for one bedroom, $1,177 for two bedrooms, and $1,377 for three bedrooms. Apartment rent in Amarillo has increased by 4.4% in the past year.
The cost of living in Amarillo, TX is 18.2% lower than the national average. Generally, housing in Amarillo is 41.8% less expensive than the national average, with rent falling between $645 - $1,377. You can expect to pay 5.7% less for groceries, 10.4% less for utilities, and 10.2% less for transportation.
Compare Cities
Explore how walkable, bikeable, drivable, and transit-friendly Amarillo, TX is for everyday living.
Fairly Walkable
Walkability
Limited Public Transit
Transit
Exceptionally Drivable
Drivability
Somewhat Bikeable
Bikeability
Public
Grades PK-5
628 Students

Public
Grades PK-5
447 Students
Public
Grades PK-5
429 Students
Public
Grades PK-5
385 Students
Sundown Lane Elementary School
Public
Grades PK-5
344 Students
Public
Grades 6-8
892 Students
Public
Grades 6-8
630 Students
Public
Grades 6-8
867 Students

Lorenzo De Zavala Middle School
Public
Grades K-8
410 Students
Public
Grades K-8
410 Students
Public
Grades K-12
464 Students

Public
Grades 9-12
213 Students
Public
Grades 9-12
2,170 Students

Public
Grades 9-12
2,187 Students

Public
Grades 9-12
1,126 Students
† Our analysis of utilities, groceries, transportation, healthcare, home prices, and other goods and services is sourced from the Cost of Living Index, a respected benchmark published by the Council for Community and Economic Research (C2ER) that provides a thorough overview of living expenses across different regions.
Rent data is provided by CoStar Group’s Market Trend reports. As the industry leader in commercial real estate information, analytics, and news, CoStar conducts extensive research to produce and maintain a comprehensive database of commercial real estate information. We combine this data with public record to provide the most up-to-date rental information available.
Consumer goods, services, and home prices are sourced from the Cost of Living Index published by the Council for Community and Economic Research (C2ER). The data on this page is updated quarterly. It was last published in June 2026.
Demographic information comes from Neustar and combines detailed address data with U.S. Census and American Community Survey statistics to produce reliable local estimates.


