

Whether you’re renting your first apartment or your fifth, it can be hard to keep up with everything that’s happening in the rental market. Prices and supply are always changing, making it difficult to know if you’re getting a good deal.
If you know what’s going on in the rental market in 2025, you can make informed decisions about where you sign a lease. We’ve compiled a list of rent statistics to help shed some light on recent trends. Let’s take a look at the state of the rental market through numbers.
Table of Contents
- Key Statistics
- Cost of Renting
- Renters Insurance Statistics
- Renter Demographics
- Regional Rental Statistics
- Rental Amenities Statistics
- Historical Rental Market Statistics
- Landlord Statistics
Key Statistics
- The U.S. national average rent for a one-bedroom apartment is currently $1,624/month. (Apartments.com)
- Without adjusting for inflation, average rent for a one-bedroom apartment in the U.S. has increased by 65 percent since 2000, and rent is expected to increase by another 1.5 percent by the end of 2025. (CoStar Group)
- The Midwest is the most affordable region for renters. (Apartments.com)
- The most offered amenities are dishwashers, refrigerators, and air conditioning. (CoStar Group)
- 35 percent of available units on Apartments.com are listed by private landlords. (CoStar Group)
Cost of Renting
The cost of renting has steadily increased over time, following an ever-increasing number of renters. According to Nerdwallet, the COVID-19 pandemic in 2020 caused a spike in rent prices. The shift to remote work also led renters to migrate to the suburbs, increasing the demand and driving up prices in historically more affordable areas.
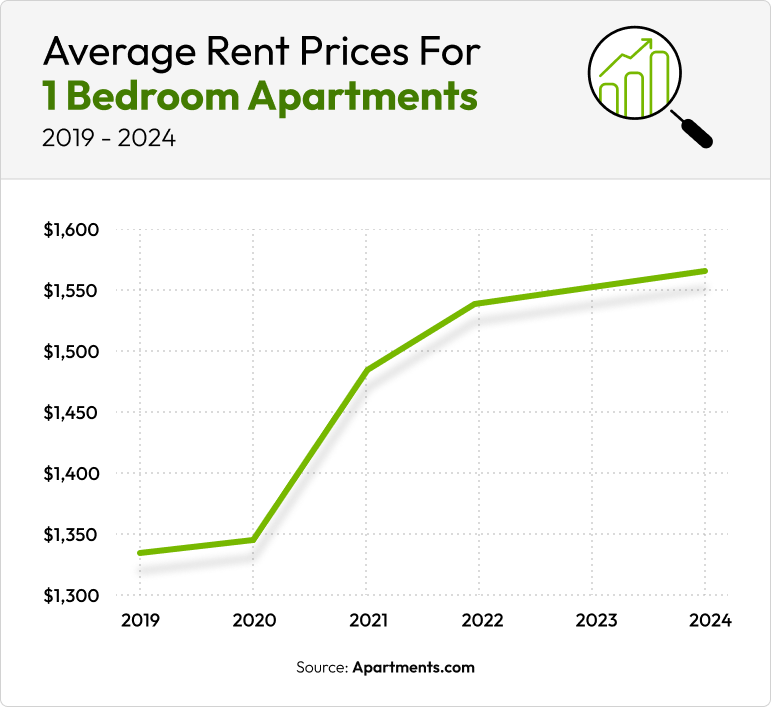
- The U.S. national average rent for a one-bedroom apartment is currently $1,624/month. (Apartments.com)
- The Midwest is the most affordable region to rent. (Apartments.com)
- The national average rent for a one-bedroom apartment increased by 10 percent between 2020 and 2021. (CoStar Group)
- The price the average American pays for rent is expected to increase by about 1.5 percent by the end of 2025. (CoStar Group)
- About half of Americans spend more than 30 percent of their income on rent. (U.S. Census Bureau)
- On average, a professional moving company charges between $200 and $500 to move into a one-bedroom apartment less than 100 miles away. (Greystar)
Apartment rent does not include additional costs like utilities, pet rent, or parking fees. The total cost of renting an apartment varies depending on the unit’s size, location, amenities, and your utility usage, so ask your property manager for a monthly estimate to get a better idea of how much money you should set aside in your budget for living expenses.
In addition to monthly fees, moving costs are another expense to consider. There are plenty of ways to save money during your move, like renting a moving truck instead of a professional moving company or moving in the winter.
Renters Insurance Statistics
Renters insurance offers financial protection for renters in case of emergencies like theft or natural disaster. Renters insurance will cover tens of thousands of dollars’ worth of repairs and replacements for a small premium paid monthly or annually.
- The average annual renters insurance premium for $30,000 in personal property coverage in 2025 is $199. (Forbes)
- Wyoming has the cheapest annual renters insurance rates for $30,000 in personal property coverage. (Forbes)
- Louisiana has the most expensive annual renters insurance rates for $30,000 in personal property coverage. (Forbes)
- Only about 55 percent of U.S. renters have renters insurance. (MoneyGeek)
- Average renters insurance premiums decreased by 9 percent between 2012 and 2021. (Insurance Information Institute)
A renters insurance policy should cover personal property and liability as well as additional living expenses. In case of theft or disaster, personal property coverage will kick in to replace any damaged or lost belongings, and additional living expenses coverage will cover temporary housing, if necessary. Personal liability coverage will protect you financially if you’re found legally responsible for another person’s injuries or property damage.
Most property managers require tenants to buy renters insurance, so you’ll need to consider your monthly or yearly premium when building a budget.
Renter Demographics
More people are renting than ever, including single-person households and renters over the age of 55.
- In 2023, 40 percent of renters lived alone. (U.S. Census Bureau)
- While the likelihood of owning a home increases with age, people ages 55 and older make up almost a third of renters. (U.S. Census Bureau)
- In 2022, 39 percent of renters had a dog and 29 percent have a cat. (American Veterinary Medical Association)
- About 25 percent of renter households include children under 18. (U.S. Census Bureau)
- Renters with a bachelor’s degree or higher made up the biggest portion of renters in 2023. (U.S. Census Bureau)
- Of the 4.6 million renter households receiving federal housing assistance, 24 percent live below the poverty line. (U.S. Department of Housing and Urban Development)
The rising demand for rentals hasn’t come without a cost. The U.S. Census Bureau reported that 49.7 percent of renter households were cost-burdened in 2023, meaning that they were spending more than the recommended 30 percent of their income on housing costs. With rent prices steadily rising, it can be hard to keep up.
Enter rental assistance programs. Rental assistance programs are government-funded programs that help low-income renters find affordable housing and pay rent. Contact your local Public Housing Agency to learn more about your options.
Regional Rental Statistics
The basic laws of supply and demand explain why higher rents are concentrated in more populated areas. The downtown areas in big cities typically have the highest rent prices because they are usually business districts where the majority of residents work, and proximity to work, school, and entertainment makes an area a hot commodity.
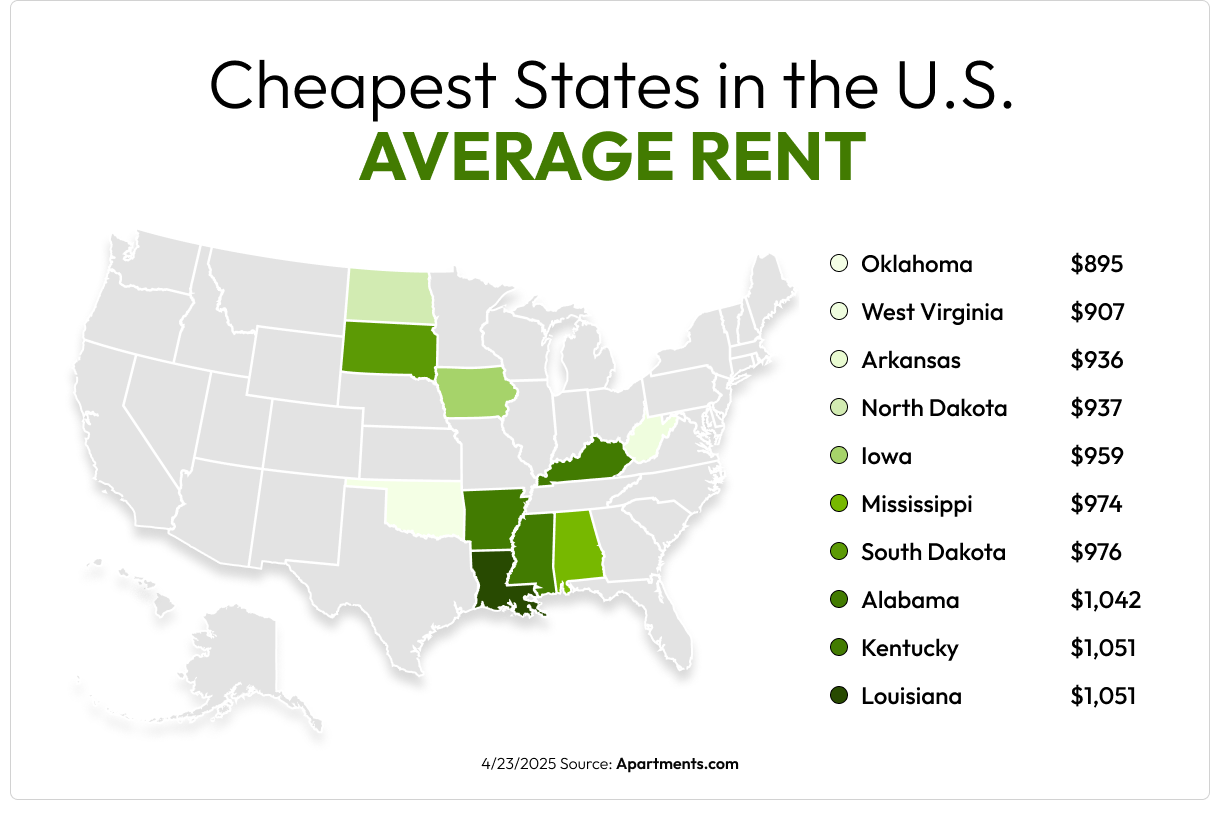
- Oklahoma has the lowest rent, averaging $895/month. (Apartments.com)
- New York has the highest rent, averaging $2,926/month. (Apartments.com)
- States in the Midwest have the most affordable rents. (Apartments.com)
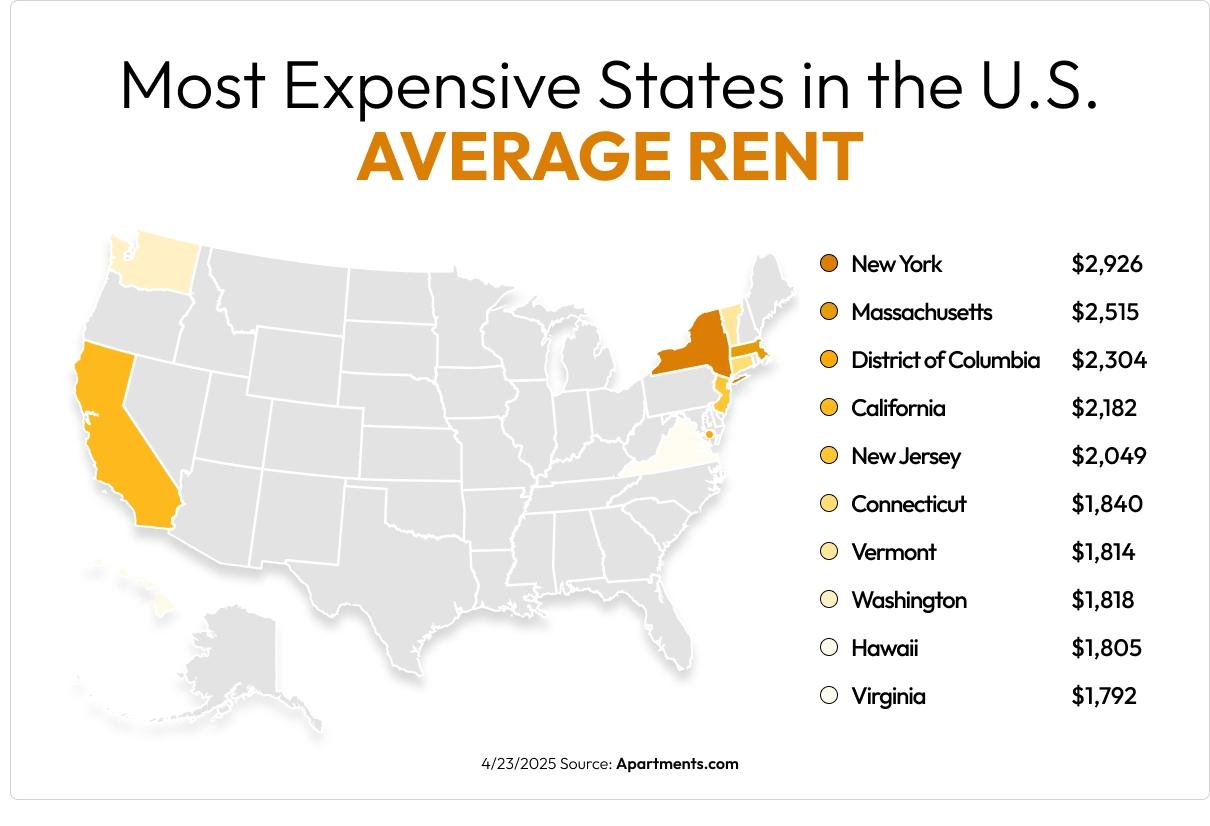
- In 2024, the cost of living in NYC was 128 percent higher than the national average. (Apartments.com)
- Mississippi had the lowest cost of living in 2024, 20 percent lower than the national average. (Forbes)
- Hawaii had the highest cost of living in 2024, 37 percent higher than the national average. (Forbes)
- New York City is the most populous city in the U.S., with a population of 8,258,035. (U.S. Census Bureau)
Rental Amenities Statistics
Data repeatedly shows that renters want amenities that make their lives easier.
- The most searched amenities on Apartments.com in 2025 are in-unit washer and dryer, air conditioning, parking, dishwasher, and utilities included. (CoStar Group)
- Dishwashers, refrigerators, and air conditioning are the most offered amenities on Apartments.com. (CoStar Group)
- 79 percent of available units listed on Apartments.com are pet-friendly, allowing either dogs or cats. (CoStar Group)
- According to a January 2025 survey, fitness centers and pools were must-haves for 22 percent and 16 percent of respondents, respectively. (CoStar Group)
- More than 105,000 listings on Apartments.com include a fitness center, and more than 66,000 include a pool. (CoStar Group)
Dishwashers, in-unit laundry, and parking are consistently the most searched amenities on Apartments.com, regardless of geographic location. Luckily, the most offered amenities align with demand, with dishwashers, refrigerators, and air conditioning at the top.
Historical Rental Market Statistics
With renting becoming increasingly popular, rent prices have followed the demand. While inflation has played a major role in the rise of rent prices over the last few decades, high demand has been a main factor.
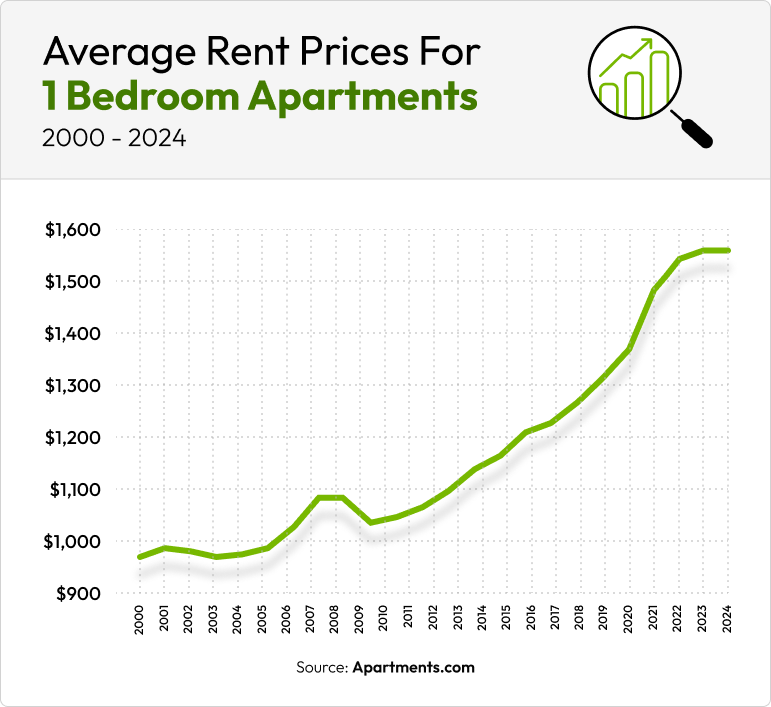
- Without adjusting for inflation, average rent for a one-bedroom in the U.S. has increased by 65 percent since 2000. (CoStar Group)
- Between 2000 and 2023, the number of renter-occupied units in the U.S. increased by 28 percent. (U.S. Census Bureau)
- Between 2000 and 2023, the number of U.S. renters living alone increased by 40 percent. (U.S. Census Bureau)
- The 1970s saw the most significant increase in the number of renters living alone. (U.S. Census Bureau)
According to NerdWallet, the higher-than-ever demand for rentals is driven by more renters looking to live alone, prospective homeowners remaining renters for longer, and a migration of renters to the suburbs.
Landlord Statistics
Property management companies are corporations that own multiple rental buildings, and they typically invest in large multifamily buildings like apartment communities or condo buildings. Private landlords are individuals who rent out property they own.
Private landlords typically invest in houses, townhomes, or duplexes, and they usually only own a few rental properties. While private landlords can be found anywhere, property management companies concentrate their rentals in major cities with higher population density.
- 35 percent of available units on Apartments.com are listed by private landlords managing fewer than three properties. (CoStar Group)
- Property management companies only own about 18 percent of rental properties, but the individual units make up 45 percent of all rental units. (U.S. Census Bureau 2021 Rental Housing Finance Survey)
- 68 percent of property managers are private landlords, most of whom own less than four units. (U.S. Census Bureau 2021 Rental Housing Finance Survey)
- 43 percent of private landlords spend less than 10 hours each month managing their property. (U.S. Census Bureau 2021 Rental Housing Finance Survey)
- Landlords filed over 1 million evictions in 2024. (Eviction Lab)
Knowing the management style of a property before you sign a lease can help give you a better idea of what to expect during your lease cycle. Because property management companies often have properties in multiple states, their lease terms are rigid, and property managers will follow set protocol.
Private landlords make their own rules and can bend them as they see fit, which can benefit renters with no credit or bad credit.
If you liked a specific property management company’s management style and want to stick with what you know when moving to a new city, check out our Property Management Company Directory to find more of their rentals.
Stay Informed While Apartment Hunting
There are a lot of unknowns when moving into a new apartment, but your budget shouldn’t be one of them. Our Cost of Living Calculator can help you build a budget for your new apartment by showing you how your everyday expenses will change in a new city, and our monthly rent reports can help you stay up to date on what’s happening in the rental market.
Apartments.com has the tools to help you through your rental journey, from budgeting for an apartment to finding your perfect place.
FAQs
How much of my income should I spend on rent?
Most property managers require your pre-tax income to be three times the rent. While this is mainly to ensure that their tenants are able to pay rent, it also keeps you from spending too much on rent.
While the exact dollar amount depends on your lifestyle and monthly expenses, most financial advisors suggest spending no more than 30 percent of your monthly pre-tax income on rent. The 50-30-20 rule is a common budgeting technique, where 50 percent of your income goes to essential living expenses, 30 percent is for non-essential expenses, and 20 percent is for savings and retirement. This guideline helps you live a fulfilled life while still being financially healthy.
If you’re having trouble figuring out your budget when apartment hunting, our rent calculator can help you set a rent budget and find rentals in your price range.
How often do rent prices change?
Rent prices change daily, so finding an affordable place to live can all come down to when you’re looking to move. Apartment prices fluctuate based on supply and demand, depending on the time of the year, month, or even week.
You can expect rental prices to be lowest when supply is highest and demand is lowest. Supply tends to rise when apartment leases end at the end of the month, creating more vacancies. Demand tends to drop in the fall and winter, when schools are in session and the weather isn’t as suited for moving. This means you’ll likely find the most affordable prices at the beginning of each month and during the fall and winter.
What are the pros of renting instead of buying?
Long-term renting has become a trend in recent years largely due to the competition in the housing market and the cost and responsibility that come with owning a home.
- Rent is cheaper than a mortgage. According to Business Insider, the average mortgage payment is $2,715 per month on a 30-year fixed mortgage. This, combined with a down payment and property taxes, is much more expensive than the average rent of $1,576/month.
- Renters enjoy free maintenance, since property managers are responsible for most repairs and appliance upkeep, saving thousands of dollars in home maintenance each year.
- Renters enjoy more flexibility in their lifestyle, since they can move cities faster and cheaper than homeowners.
- Renters don’t have to worry about housing market crashes decreasing their home’s value and making it harder to sell.


